
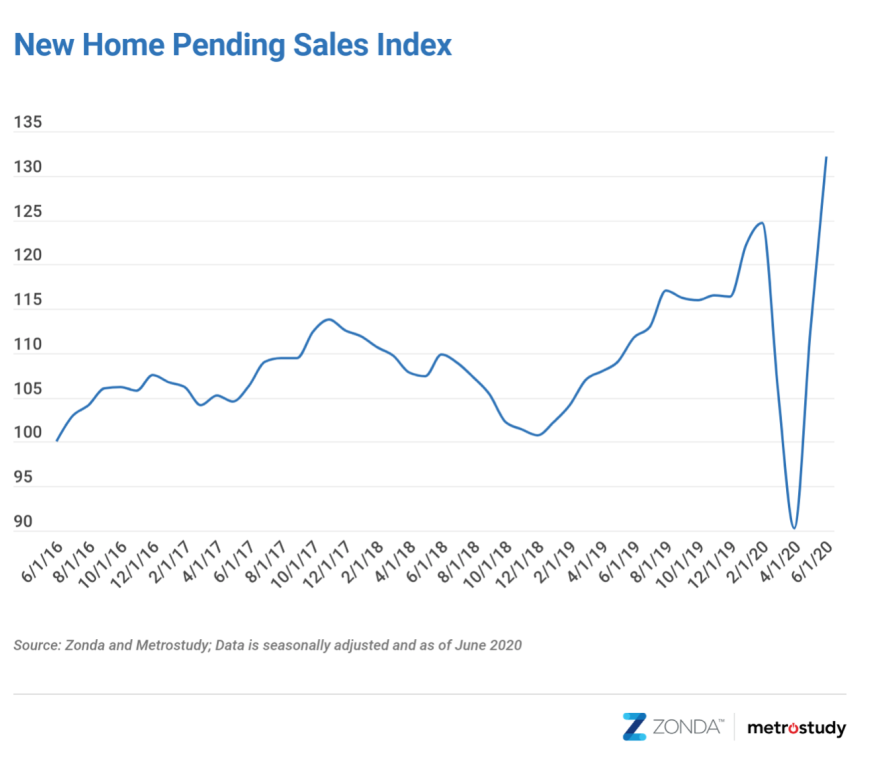
The latest New Home Pending Sales Index (PSI) from Meyers Research for June 2020, backed by data from Zonda and Metrostudy, shows pending sales increased month over month and year over year across the United States. The index is a leading residential real estate indicator based on the number of new-home sales contracts signed across the country.
The New Home PSI came in at 132.2 for June, representing an 18.2% increase from June 2019. On a month-over-month basis, new-home sales rose by 17.5% from May. June is historically a slower month than May, so the month-over-month gain shows that the traditional spring selling carried on later in the year.
“When life as we knew it got turned upside down, our homes became the only constant,” says Ali Wolf, chief economist at Meyers Research. “The shift toward at-home work, school, and hobbies, however, resulted in a rethink of our space that propelled new home sales to the highest level since 2007.”
Pending new-home sales continued to show major locational differences, but all of the select 20 markets in the country posted month-over-month gains and nearly all trended above June 2019 as well.

The best new-home markets in June were Raleigh, N.C.; Cincinnati, and Tampa, Fla. Raleigh and Tampa had strong housing markets pre-COVID-19 and, after a brief pause, buyers are back in full force. Lifestyle and positive net migration are two big contributors to the success for these housing markets today. In Cincinnati, the combination of a relatively low unemployment rate and extremely constrained resale inventory is helping builders attract buyers and gain market share.
“There is no doubt that sub-3.0% mortgage rates have played a big role in the rapid rebound of the housing market,” Wolf says. “There aren’t many more compelling reasons to buy a home than virtually free money.”
Philadelphia, Los Angeles, and New York all posted substantial month-over-month increases but are still down compared with last year. In these markets, the relative underperformance is partly due to a lack of inventory. For example, the total number of new-home projects for sale decreased in each market year over year, and affordability in some of the remaining communities is constrained even with the lowest mortgage rates on record. Within each of these markets, however, some builders had a record-breaking sales month in June and are seeing homes fly off the shelf quicker than they can replace them.
New-home data is susceptible to outsized swings in contract activity based on shifts in the number of actively selling communities. As a result, Meyers Research normalizes the data to ensure consistency across the index. The New Home PSI blends the cumulative sales of active or recently sold-out projects with the average sales rate per community, which adjusts for fluctuations in supply. Furthermore, the New Home PSI is seasonally adjusted based on each markets’ specific seasonality and removes outliers. The index is baselined to 100 for June 2016. Today’s national New Home PSI is 32.2% above the base level.


