From over 20 million jobs lost in two months to trillions of dollars of federal stimulus contributing to a record-high savings rate, American consumers, and their pocketbooks, have been on a wild ride since the start of the pandemic.
Nearly three years later, inflation remains a lingering effect of that wild ride. As of December 2022, inflation, as measured by the Consumer Price Index, was up 6.5% year over year. A different measure of inflation, using the Personal Consumption Expenditures method—typically considered a better metric since it accounts for people substituting their purchases in response to higher prices—is up 5.0% compared with last year.
For a while, many households were seemingly unfazed by higher costs, exemplified by growing consumer spending. However, the persistently high inflation has eroded the purchasing power of growing wages seen across the economy and is having a noticeable impact on household budgets.
The personal savings rate is currently at 3.4% as of December 2022, compared with the 20-year historical average of 6.8%. Further, data from the Federal Reserve Bank of New York shows that credit card debt is on the rise, up 15% year over year, after falling during the early days of the pandemic.
The cost of shelter is a significant contributor to inflation and as the overall price of housing has risen around the U.S., many households are finding they are putting more of their income toward housing when compared with the past. Data from the Bureau of Labor Statistics backs this up, but the impact varies by income group and region. The chart below shows housing’s share of total spending by income group.
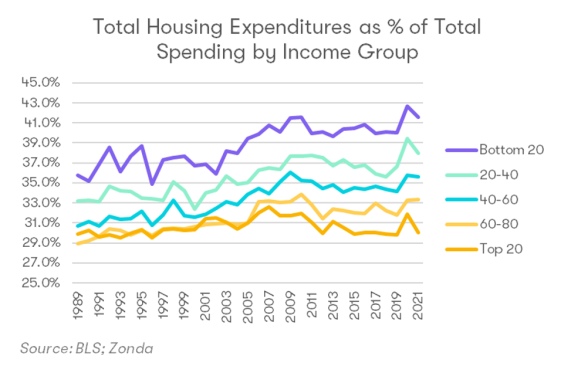
- The bottom 20% of Americans in the income distribution find basic necessities make up a large part of their income. In 1989, the lowest income cohort allocated roughly 36% of their spending toward housing. That jumped to over 41% during the housing boom in the mid-2000s and reached nearly 43% in 2020. The level in 2021 was 42%, but we estimate this has risen for the full-year 2022 on higher interest rates and continued home price appreciation. For this lower-income group, inflation and wages are not keeping pace with the cost of housing and the expectation is that becoming a homeowner will remain difficult for the foreseeable future.
- The 20% to 40% cohort consists of renters and homeowners. Individuals in this income band could be categorized as what Zonda calls an entry-level buyer, including lower-income households, younger buyers, and existing renters. This group is extremely cost sensitive, but for those who are renting, there’s a strong preference to own a home one day. However, housing costs now represent 38% of the household budget for those in this cohort, up from 33% in 1989.
- Middle and upper-middle class individuals are within the range of what is deemed reasonable for housing spend. A general rule of thumb is that roughly 30% to 35% of income spent toward housing is reasonable and manageable. Those in the 40% to 60% income levels spent roughly 31% of their budgets on housing in 1989. That has risen to about 36%. Those in the 60% to 80% range moved from 29% of their budget on housing to 33% over roughly 30 years.
- The top 20% has seen little change to their housing costs. People in the last group have seen housing expenditure as a share of their spending not change substantially in 30 years, starting at 30% in 1989 and staying flat at 30% to 2021. Wealth is a bigger driver of home purchases than income at this level, and this group has a large share of individuals who are not as sensitive to interest rate changes. In turn, we are finding buyers in this cohort are still more active in today’s housing market despite higher home prices and interest rates.
Overall, housing has become more expensive for most income groups with the lower-income households hit hardest, especially when housing costs are combined with higher levels of inflation. In fact, first-time buyers now represent an all-time low of total transactions (with data starting in 1981), and the age of those first-time buyers has hit a record high of 36.
The high-end and more luxury buyers have seen less of a burden in housing cost compared with their overall spending, which has allowed the segment to show more resilience during the current shift in the housing market.
These stats also vary by region, however. For example, residents in the West and Northeast have and will continue to spend more on housing compared with those in the South and Midwest.
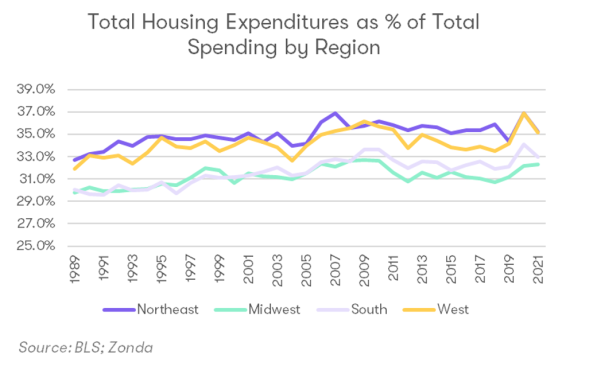
- Housing in the Northeast has historically taken up the largest share of household budgets. The Northeast has more established communities, older housing, and less developable land than the other regions. These local dynamics contribute to relatively more expensive housing. The typical household spent 33% of their budget on housing in 1989, which has risen to 35.3% as of 2021.
- Pronounced barriers to growth in the West. The West region has nearly pulled even with the Northeast as the most expensive region for housing with households putting 35.1% of their budget toward housing. The percentage is even higher in markets like Los Angeles, San Francisco, and Seattle. Geographic barriers, high demand, and stricter, costlier, and more lengthy government regulations make it difficult to build more homes to scale, only exacerbating the problem.
- Rapid change in the South. Many cities in the South, including Charlotte, North Carolina, Austin, Texas, and Nashville, Tennessee, have seen rapid migration and home price appreciation over the past few years. Overall affordability levels are still below those in the Northeast and West but are near the highs reached in the run-up to the Great Recession.
- The Midwest is the affordability winner. The Midwest has been the lowest cost region for the better half of 30 years. Households in the Midwest spend an average of 32% of their budget on housing. Zonda recently detailed the Midwest’s great relative affordability, though home price appreciation since 2020 and higher mortgage rates are pushing some buyers to the limit.
As we think about where we go from here, Zonda highlighted in a New York Times opinion piece in 2021 some changes that can help affordability, including more pro-housing zoning, smaller/more units being built, and a push for greater training and recruitment for construction workers. These actions and other creative solutions are important to help create a more sustainable housing market that works for a diverse group of Americans. After all, housing is an important driver of overall economic activity and homeownership is a key pillar for wealth building.