
Over the past 10 years, the geography of U.S. home building has changed in ways that feel both familiar and new. While the industry has long followed jobs, affordability, and population growth, the speed and scale of recent shifts have redrawn the map of top producing metro areas. Zonda’s analysis of the top 50 markets by new-home closings in 2015, 2020, and 2025 shows where builder activity has migrated, concentrated, and, in some cases, retreated.
2015: An Evenly Distributed Starting Point
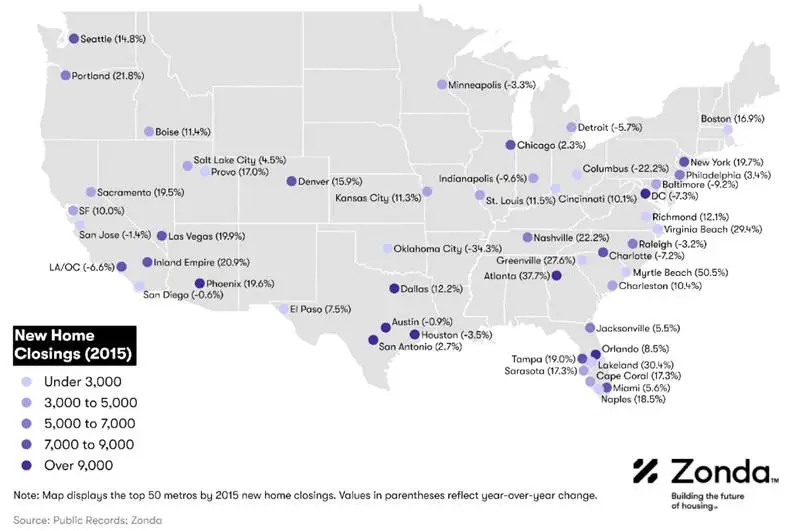
In 2015, new-home production was broadly distributed across the country. Large, established metros led in absolute volume, but no single region dominated.
- Texas was already emerging as a standout, with Houston, Dallas, and Austin all ranking in the top five. Strong employment growth, a business‑friendly environment, and room to expand gave builders confidence to scale.
- At the same time, the Southeast was gaining momentum. Atlanta stood out for growth, while Florida markets such as Orlando, Tampa, Miami, and Jacksonville played important roles in national production.
- High-cost coastal metros such as Washington, D.C., and Los Angeles still delivered meaningful volume, but growth was already softening as regulatory complexity, land constraints, and elevated prices limited expansion.
2020: Migration Takes the Lead
By 2020, pandemic era dynamics accelerated trends that were already underway, pushing demand toward markets that could offer scale, relative affordability, and lifestyle appeal. National new-home closings surged, but gains were uneven across metros.
- The Carolinas entered a clear expansion phase as Raleigh, Charlotte, Greenville, and Wilmington climbed the rankings, signaling growth beyond primary metros.
- The West also heated up. Phoenix emerged as a top-tier market, while interior and Mountain West metros, like Boise, gained relevance as buyers sought alternatives to higher-cost coastal locations.
- However, several legacy markets lost ground or dropped out of the top 50 altogether as affordability eroded and domestic outmigration intensified.
2025: The New Map of Home Building
By 2025, new-home production settled into a more concentrated pattern. Activity is increasingly clustered in large Sunbelt hubs and select secondary growth markets.
- Texas and the broader Southwest continued to anchor the top of the rankings, even as overall volume moderated from earlier peaks.
- Florida’s footprint expanded significantly, with a wider mix of large and smaller metros contributing to national activity.
- Meanwhile, newer Sunbelt and secondary markets displaced long standing coastal metros like San Francisco and Boston, highlighting a clear turnover in where builders are able to sustain activity.
Key Lessons for Builders
Overall, the past decade reinforces that housing is fundamentally a local story. Even within the same state, markets can move in very different directions depending on affordability, migration flows, and the ability to bring supply to market. As builders look ahead, opportunity, and risk, will remain increasingly defined market by market.
The insights in this article were taken from a more in-depth research report published in Zonda’s National Outlook.