
The pandemic has had a dramatic impact on housing demand, including influencing what type of homes people prefer and where they want to live. As a result of the freedom allowed by remote work, higher-cost areas saw some people flee to less expensive parts of the country in search of more space and a lower cost of living. The positive demand shock in many lower-cost markets was exaggerated from early 2020 through early 2022; consumers were scooping up homes, sometimes sight unseen, and the increased demand drove unprecedented home price appreciation.
While there are signs that the relocation boom is cooling and the demand pool is shrinking, buyers moving from one market to another continues to be an important part of the housing affordability discussion. The Zonda Affordability Ratio (ZAR) was developed to better capture the role of migration in affordability.
In the early days of the pandemic, full-time work from home was widespread across the country and seen in different industries. Compared with pre-pandemic levels, the broader acceptance of remote work has remained a big shift, resulting in more varied employment options, including full-time work from home, hybrid work schedules, and full-time office work.
Findings from Kastle Systems, the leading source on office data, captures a 10-city occupancy rate average of 47.2% as of late September. Prior to the pandemic, the occupancy rate was over 90%. The mixed return-to-office plans means there are still people moving for affordability, lifestyle, weather, and employment reasons.
The ZAR is unique in that it accounts for the impact of relocation buyers. Typically, affordability indices use local incomes and home prices. However, if a person relocates from New York City to Austin, Texas, with a work-from-home job based in New York, their income remains coded in New York. The ZAR improves on past metrics by showing the “true” affordability by considering local incomes as well as the incomes of individuals moving to the specific metro. The ZAR shows the percentage of households that can afford the median-priced home.
In many lower-cost markets, the ZAR will show greater affordability than nonadjusted affordability indices. However, national trends and policy still have an effect. For instance, the 30-year fixed mortgage rate has risen from 3.2% in January 2022 to over 7% through October. This has dampened demand on the national housing market and is reflected in the declining affordability seen across the country. Rising rates, coupled with two-plus years of price increases, have contributed to pushing the market into a historic affordability crunch. At the national level, single-family sales have fallen below levels last observed in 2019. The extent of the shock and the ensuing slowdown will depend on the market.
See below for the ZAR chart and select highlights:
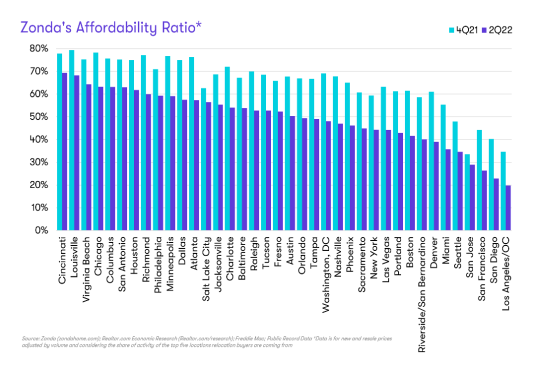
Courtesy Zonda
- Three of the five most affordable markets are in the Midwest. Cincinnati and Columbus, Ohio; Louisville, Kentucky; Virginia Beach, Virginia; and Chicago make up the top 5 most affordable metros. While sales in the Midwest have slowed with the rest of the nation following the record affordability shock, top markets in the Midwest stand out as outperforming in this softer market.
- California tops the least-affordable list again. As with the last time Zonda published the ZAR, four out of five of the least affordable markets are in California given geographic limitations, tight land supply, and regulatory hurdles. Higher mortgage rates have an outsized impact on these markets given the higher average selling price, and we are seeing demand slow in response. In the long run, however, we see the demand pool continuing to outpace supply given the favorable climate, desirable lifestyle, and diversity in job opportunities.
- Where else is affordability struggling? Denver, Miami, and Seattle were the least affordable metro areas outside of California. Of these markets, Miami sales are holding up relatively well given the lower taxes, desirable climate, and healthy labor market support relocation activity. Sales in Seattle and Denver have slowed notably in 2022.
- Return to office? As more employers continue to push a hybrid schedule or a full return to the office, some housing demand may be flushed back to the more traditional job hubs. In the same vein, markets that were buoyed largely by work-from-home buyers may be susceptible to more pronounced slowing in housing demand following any kind of big push to return to the office.
The ZAR is a valuable reference for home builders as it tracks affordability in a unique way, taking account of relocation buyers as well as local incomes. As the market continues to absorb the impact of rising mortgage rates, affordability will be a key concern for builders and buyers alike.