
The housing market needs buyer affordability, consumer confidence, and a healthy labor market to function properly, all of which are currently in question. In fact, new-home sales are down 35.4% following more than two years of relentless home price appreciation and mortgage rates reaching the highest levels in 20 years.
The broad macroeconomic factors related to inflation and higher interest rates are impacting virtually every corner of the country. There are, however, pockets of the United States where the housing markets are bucking the national trend, either to the positive or to the negative.
For example, the Western markets have cooled much quicker compared with other regions. Of our select major markets, the Zonda New Home Pending Sales Index (PSI) has dropped the most year over year in Phoenix (-70.8%), Denver (-67%), Sacramento, California (-62.8%), San Francisco (-61.6%), and Salt Lake City (-57.2%). San Francisco is getting hit by a slowing tech sector and an unstable stock market. Phoenix, Denver, Sacramento, and Salt Lake City were among the work-from-home housing markets that grew too much too quickly, and the resulting lack of affordability is impacting demand.
Markets across the Eastern U.S. have held up better, all things considered. Baltimore was the only one of our select markets to post a year-over-year increase in total activity (+8.8%) for October. Minneapolis, Houston, Cincinnati, and Jacksonville, Florida, have posted year-over-year declines, but the level was more muted compared with national trends.
Given the clear East/West divide, our team went about figuring out key differences to help explain the divergence behind the regions. We examined migration rates, employment trends, the absolute levels of home prices, the rate of home price appreciation since 2020, and the impact of relocation buyers. Each of these factors support the growth in housing we’ve seen since the start of the pandemic, but none were able to clearly explain the regional differences.
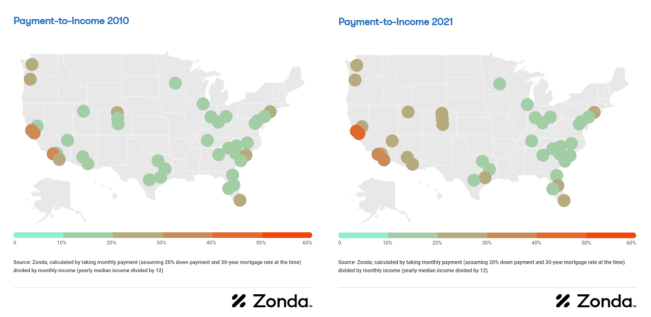
The most pronounced answer came when looking at payment-to-income levels. In 2010, relative affordability started off broadly across the nation following price drops post-Great Recession. The housing market moved from recovery to growth mode from 2010 through 2020. Concerns of housing affordability pressures became commonplace around 2017, but the market continued to grow into 2020, when the pandemic turbocharged interest in housing.
The quick drop in mortgage interest rates and the accompanying pop in demand pushed overall inventory levels down and home prices up starting in 2020. Most markets were growing at what was deemed an unsustainable pace, and, by 2021, there were signs that payments relative to incomes were starting to get out of whack, in particular, in the West.
Local buyers, lower-income households, and entry-level home shoppers have found the market increasingly difficult to navigate given higher prices and mortgage rates. The maps below illustrate the shifting affordability over the last decade plus, showing payment-to-income maps for the years 2010 and 2021 (which is the most recent full year of data).
Income, admittedly, is not a perfect measure of purchasing power because it doesn’t capture wealth, but it allows for an “apples-to-apples” comparison across metropolitan areas based on incomes and estimated payments.
While the payment-to-income ratio is the most out of line in the West, housing affordability is a concern across the country. Many prospective home buyers have been pushed to the sidelines, waiting for some combination of home prices and mortgage rates to come down. This group of prospective buyers provides both a challenge and an opportunity for the industry given the sheer size of those sidelined that still want to be homeowners.
Solving for affordability is difficult, especially when many buyers are looking for an aspirational home at a reasonable price. To help alleviate some of the pressures, builders, developers, and government officials can prioritize development near public transportation, convert unused retail or office space to additional housing, and focus on higher density. Doing these things can create a better alignment of home payments to incomes that can support a growing housing market.