
New Jersey, Illinois, Texas, Vermont, and Connecticut had the highest property tax rates in the nation in 2018, according to ATTOM Data Solutions.
Attom performed its 2018 property tax analysis using data for more than 87 million U.S. single family homes, and it showed that property taxes levied on single family homes in 2018 totaled $304.6 billion, up 4% from $293.4 billion in 2017 and an average of $3,498 per home — an effective tax rate of 1.16%.

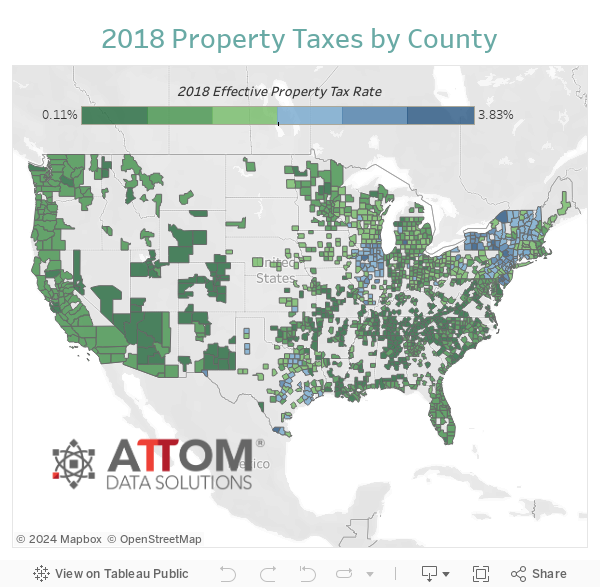
The average property taxes of $3,498 for a single-family home in 2018 was up 3% from the average property tax of $3,399 in 2017, and the effective property tax rate of 1.16% in 2018 was down from the effective property tax rate of 1.17% in 2017. In New Jersey, the most taxed state in the nation, that rate was nearly double the average at 2.25%. Behind New Jersey on the tax-happy list were Illinois (2.22%), Texas (2.18%), Vermont (2.16%), and Connecticut (2.02%). Other states in the top 10 for highest effective property tax rates were New Hampshire (1.99%), New York (1.86%), Pennsylvania (1.79%), Ohio (1.69%), and Wisconsin (1.58%).
The report analyzed property tax data collected from county tax assessor offices nationwide at the state, metro and county levels along with estimated market values of single family homes calculated using an automated valuation model (AVM). The effective tax rate was the average annual property tax expressed as a percentage of the average estimated market value of homes in each geographic area.
"Property taxes levied on homeowners rose again in 2018 across most of the country," said Todd Teta, chief product officer for ATTOM Data Solutions. "While many states across the country have imposed caps on how much taxes can go up, which probably contributed to a slower increase in 2018 versus 2017. There are still many factors at play that can contribute to local property tax hikes, and without major changes in the way a community runs public services, tax rates must rise to pay for them."
Among 219 metropolitan statistical areas analyzed in the report with a population of at least 200,000, those with the highest effective property tax rates were Binghamton, New York (3.19%); Syracuse, New York (2.89%); Rochester, New York (2.88%); Rockford, Illinois (2.83%); and Atlantic City, New Jersey (2.74%).
Of the 219 metropolitan statistical areas analyzed in the report, 120 (55%) posted an increase in average property taxes above the national average of 3%, including Los Angeles (5% increase), Dallas-Fort Worth (8% increase), Washington D.C. (4% increase), Atlanta (7% increase), and San Francisco (7% increase). Other major markets posting an increase in average property taxes that was above the national average were Riverside-San Bernardino (up 5%), Seattle (up 14%), Minneapolis (up 6%), San Diego (up 5%), and Tampa (up 4%).
States with the lowest effective property tax rates were Hawaii (0.37%), Alabama (0.48%), Colorado (0.51%), Nevada (0.57%), and Utah (0.57%). Other states in the top 10 for lowest effective property tax rates were West Virginia (0.58%), Delaware (0.61%), Arizona (0.64%), Tennessee (0.65%), and Wyoming (0.66%).
Among the 219 metro areas analyzed for the report, those with the lowest effective property tax rates were Laredo, Texas (0.35%); Honolulu (0.36%); Montgomery, Alabama (0.37%); Tuscaloosa, Alabama (0.39%); and Colorado Springs, Colorado (0.42%).
Among 1,408 U.S. counties with at least 10,000 single family homes, those with the highest average property taxes on single-family homes were largely located in the greater New York metro area, led by Westchester County, New York ($17,392); Rockland County, New York ($12,925); Marin County, California ($12,242); Essex County, New Jersey ($12,161); and Bergen County, New Jersey ($11,771).


