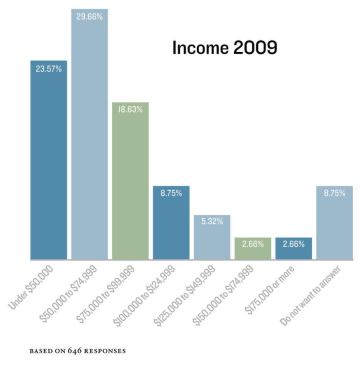
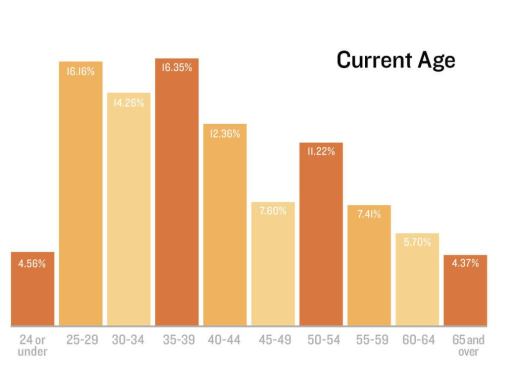
AGE AND INCOME: Today's shoppers tend to be young, and they tend…
Let’s face it: This year’s home-sales market is the coldest since the Great Depression. Buyers went back into hibernation en masse in May, as federal tax credits expired—and June’s anemic rebound was nothing to write home about.
But that doesn’t mean the market’s dead. Hundreds of thousands of customers are still shopping. They’re serious, and they know what they want—and in a market this weak, it’s more important than ever for builders to know that too.
For the second year, American LIVES conducted a survey this spring for Builder of just those active buyers. In nine markets across the country—California, Nevada, Arizona, Texas, Florida, North Carolina, Virginia/Washington, D.C., Michigan, and Indiana—real customers, including model-home visitors as well as actual recent buyers, agreed to fill out a survey about their personal situations, their preferences, and their ultimate choices.
Builder Magazine/American LIVES Survey 2010
Here’s a quick look at what the numbers show.
Demographics
The people who are buying homes this year are not the broad cross-section that swarmed models in 2004 and 2005. It’s a younger crowd, with a big chunk of thirty-somethings, and even a few under-25s; almost 65 percent are younger than 45.
Married couples make up a solid majority. Families with kids, both single parents and couples, also predominate (see “Married (Maybe) with Children,” page 92). But that still leaves a significant subset of solo home buyers.
As for buying power, this year’s crowd skews toward the affordable end of the market—or, at best, the mid-range. A quarter earns less than $50,000 a year, a third make between $50,000 and $75,000, and about a fifth earn $75,000 to $100,000. Fewer than 20 percent earned more than $100,000 a year.
Attitudes
The survey asked shoppers about their economic situations, their reasons for buying, and the meaning of homeownership in their lives. The data’s not hard edged, but the responses carry a clear flavor. Hope, in these tough times, is tempered with practical, frugal thinking. Strong majorities agreed with statements such as, “Spending time at home with my family has become more important to me;” “I’m spending money more cautiously now;” and “I’m not going out as much, so my home is more important.” And 94 percent agreed with the statement, “I don’t want to stretch my finances too much when buying a home.”
As in the survey last year, respondents have serious concerns about the economy, and about their own job security. Seventy percent describe current economic conditions as “not so good.” Perceptions of current economic trends are split: 27 percent think things are getting worse right now; 27 percent think they are getting better; and 45 percent think they’re staying the same. Only 37 percent are not personally worried about losing their jobs; 41 percent say they’re “somewhat concerned” about losing a job; 14 percent are “very concerned;” and 6 percent have already lost work. Even so, 66 percent of the sample expects the economy to be doing better in a year’s time.
So why buy now? Popular reasons included, “Having a newly constructed house that is more energy efficient;” “Wanting a larger house;” and “Having a home in a better neighborhood”—all practical reasons, especially for parents with children at home. Tax incentives for first-time buyers were a relatively less important factor, checked by only 36 percent of the sample. By contrast, 52 percent selected, “Home prices and interest rates were their lowest in years.”
Preferences
About half of the shoppers surveyed currently owns a home. And almost all of these homeowners are in single-family housing, not condos or townhomes. However, this segment includes those respondents who just purchased from a builder, and it still leaves close to 50 percent that are renters. Among the renters, the vast majority are living in some kind of multifamily unit—not surprisingly, since single-family houses for rent are scarce in most markets. And of the whole sample, the large majority is shopping for a single-family home. Space matters—almost 80 percent agreed that “the most important thing to me is getting the most square footage at the lowest price.” But so does location: 68 percent agreed that “I am willing to accept a smaller home to be in the neighborhood I want.”
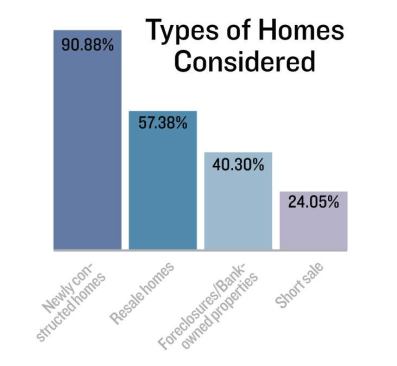
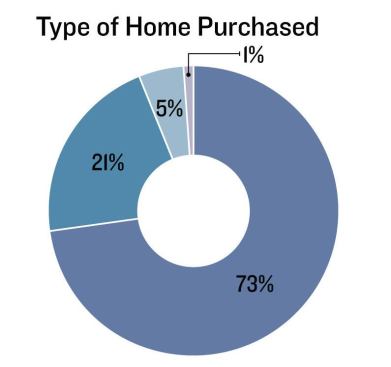
Our sample comes directly from builder sales traffic, so it’s not surprising that almost all the respondents reported shopping for new homes. But close to 60 percent also looked at existing homes; 40 percent looked at foreclosures; and 24 percent looked at short sale houses. When it came time to close the deal, however, 75 percent bought new houses, while only 21 percent purchased a resale home. Just 5 percent bought a foreclosure or bank-owned property, and barely 1 percent purchased a short sale. Again, practicality seems to have ruled the day. After all, a young family, a single mom, or retired empty-nester hardly needs the hassle of dealing with a distressed property.
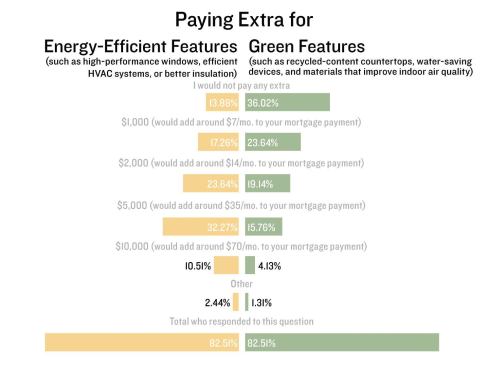
When it comes to energy and the environment, shoppers again show a practical side. In large numbers, they say they’re willing to spend $1,000, $5,000, or even $10,000 for energy upgrades (efficient windows are a popular choice, followed closely by high-performance HVAC and extra insulation). Far fewer say that they would spend money for “green” upgrades such as recycled content or sustainably produced materials.
Knowing the Unknowns
Our survey asks important questions, and it supplies strong hints about the likely answers. But it’s a high-altitude snapshot. Savvy builders always take a ground-level look, and they analyze the data thoroughly for a more granular focus.
Bob Hawksley, president of Cincinnati-based Fischer Homes, says, “We slice our demographics by product type. And we break it down by age, by income, by what their present situation is, how many have a home to sell. We ask about family size, why they’re moving—and then, the price range that they’re targeting.”
Analyst Mollie Carmichael, a senior vice president with John Burns Real Estate Consulting, says, “The first thing you do in a new area is ask about demographics. What’s the mix of non-family and family? What is the life-stage segmentation by price point, based on their income? Do they have children? Are they married? What are their household requirements? And then, how much can they afford? And oh, by the way, where do they work?”
Geography, employment, and lifestyle all interact in customers’ minds, Carmichael explains: As you go down the main transit corridors in a market area, prices may drop, but the kind of housing also changes. “So there are trade-offs about price, lifestyle, and proximity to work—all based on what I can afford, and on what’s important to me.”
So while our present survey shows a clear preference for single-family housing, for example, that doesn’t completely rule out attached housing. “Everybody who walks into our condominium models is telling me they are looking for a condominium,” says Hawksley. “But their family income is lower, because a lot of them are retired. And the buyers’ age range is at both ends of the spectrum. You have first-timers who are buying condos, and then you have the move-downs—the empty-nesters. Twenty-nine percent among our condo prospects want a smaller home; 39 percent, it’s their first home purchase. So it’s kind of a bar-bell graph.”
And single-family buyers—the much larger segment in Fischer’s business—are not a monolithic group either, says Hawksley. “We have product that ranges from $90,000 single-family houses all the way to million-dollar single-family houses. Well, they’re not the same prospect.”
“In every single metro,” says Carmichael, “everybody really prefers to buy detached. But it’s about what you can afford, right? I’m sitting right now at a new-home community in Virginia, where you can get a detached home for $150,000. You would never buy attached here, because you can buy detached for what attached costs. In fact, my cost to build attached is actually more. So attached doesn’t make sense. But in New York City, where you could never offer detached because it would be far too expensive, there’s lots of demand for attached.”
What about energy? Here, too, builders need to pay close attention to their own customers’ real responses. While our survey indicates a wide-spread willingness to spend money on energy efficiency, Hawksley sees enthusiasm tempered by value. “People want to see that it pays for itself,” he says. “They’re not willing to go and spend a whole bunch of money unless they see monthly savings, and they really want you to prove it to them.”
“We provide what the code requires, and then [let people add what they want],” Hawksley explains. Fischer’s design center displays all kinds of upgrades to each base home package, from countertops to window upgrades. “Our average sales on options probably averages $40,000. But I don’t think two grand of that is for energy upgrades,” he says. “The rest is about, you know, making it nice. We display an energy-efficient area—we don’t hide it—but they would rather spend money on nice cabinets and countertops, than on insulation.”
Future Shock
The overriding big-picture issue for market researchers today, says Carmichael, is whether the current market reflects a new long-term reality. “We’re working to put together a big study, with 4,000 or 5,000 responses, about those underlying questions,” she says. “Has the American public, or consumer, really become more frugal? Or is that just the result of the economy? Is Generation Y going to rent forever? Or just live with their parents? Is the jewel-box house here to stay, or will we go back to the McMansion?”
But to answer those questions reliably, Carmichael says, researchers will have to interview many thousands of home buyers. And to apply the big answers in context, builders will still have to take careful stock of local populations—their incomes, their working situations, their social relationships, their values, and their preferences, one town and one Zip code at a time.
Married (Maybe) With Children
For years, census figures have tracked the declining role of the traditional family—if by “traditional,” you mean a married couple with children. In the 1970s, more than 40 percent of households fit that mold; by the 2000 census, barely 25 percent of households did. Even more rare in the 2000s is the married couple with kids where Dad is the sole breadwinner: By the most recent figures, those “Leave it to Beaver” families now account for just 7 percent of the nation’s households.
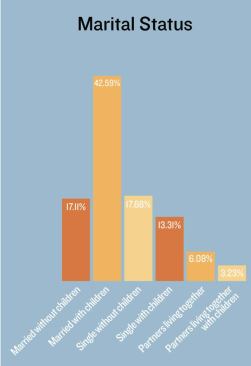
Our survey sample reflects that trend. A significant portion are singles, childless couples, or unmarried partners. Nevertheless, families with children still outweigh the rest, even though the household may be anchored by a single mom or dad. And though singles are important, couples still count.
By the numbers, married couples (with or without kids) make up about 60 percent of the survey response. And families with kids (including marrieds, single parents, and partners living together) also add up to about 60 percent. But the two groups aren’t identical: 17 percent of married couples have no children at home, and 13 percent of the families with children are single-parent households.
What does this mean for builders tuning their product to the market? Well, it’s complicated. But the prevalence of homemakers who have kids to raise may help to explain our sample’s strong preference for single-family homes—as well as their subjective feelings about their home’s purpose as part of their lifestyle. For solo parents as well as couples with kids, a house with a yard, in a neighborhood that is mostly stable owners (rather than more transient renters), could be part of their overall strategy for providing safety and comfort to their youngsters. And some young childless couples, too, might be looking for that best spot to start a new family.