
2023 is expected to be a complicated year for the housing market. Headwinds like low consumer confidence levels, a potential recession, and expensive housing costs will be working against some of the tailwinds such as a large backlog of potential home buyers trying to make sense of the market.
Given the dynamic backdrop and based on the information we have today, Zonda forecasts home sales, prices, and starts to be lower in 2023 compared with 2022. As always is the case with the housing market, though, the relative strength and weakness compared with the national forecasts will depend on where you are located. With this in mind, we have created our annual top markets list for 2023.
Each year, we like to approach our list from a different angle:
- In 2021, we highlighted markets that had relative growth potential driven, in part, by strong infrastructure and connectivity. That list was intended to capture the impact of changes to housing demand brought on by the pandemic.
- Last year, our top markets list for 2022 was focused on affordability and the entry-level buyer segment given the rapid run-up in prices.
- This year, we are looking at the most interesting markets to watch for 2023.
The reason we are calling these markets the most “interesting” versus the “best” is because, while they rank high on our list, they have some lingering question marks related to their success for the coming year.
Like previous years, we created an index to guide the analysis. We wanted to capture the markets that offer the best combination of affordability as well as the ability and desire for prospective home buyers to move in this market. Our most interesting markets have strong fundamentals, but, as mentioned above, are not necessarily expected to have a stellar year for housing demand given other limiting factors.
The inputs to our index are as follows:
- Rent vs. own math. This component accounts for the attainability of the typical mortgage payment relative to typical rent. Despite historic price appreciation and high mortgage rates, there are still markets where ownership is cheaper than the cost of rent. We use this as a proxy for measuring people’s desire to continue to buy despite the recent decline in for-sale affordability.
- Percent of homes that are mortgage-free. The dramatic swing from historically low rates to pushing above 6% has presented problems for the housing market. In addition to the obvious affordability issues, there has been a “lock-in effect,” meaning it is increasingly difficult to convince new homeowners to trade in their low existing mortgage rate for the higher current market rate. We included the percent of homes that are mortgage-free in our index to account for the share of homeowners who own their homes outright and could more easily move. Please note, though, the data is dated for a few metros.
- Number of new-home projects below $300,000. Homes priced below $300,000 hit an affordability threshold that allows those with incomes in line with the national average to be able to afford a home. The share of these homes on the market, however, has been steadily disappearing given higher land, labor, material, and governmental costs. As rates are expected to remain elevated in 2023, lower priced inventory will stay in demand and markets that have a relatively high share of the overall market could see some outperformance related to sales.
- Change in typical payment since the start of 2022. We calculated the change in the monthly payment by market, which includes higher interest rates and market-specific appreciation trends. The markets with the largest growth in payments were dinged in the index.
- Long-term high-income job growth. The last decade-plus has seen many metros change the makeup of their employment market. Typically, higher-income individuals are more likely to be or become homeowners, so we wanted to track where there has been the most growth. The inclusion of this component highlights the potential resiliency in these metros. Note, though, we expect some near-term job losses related to an economic recession that would impact employment trends in the short term. Further, high-income job growth can’t prevent a housing market from slowing if either consumer confidence is battered or absolute levels of affordability are out of line with incomes. Even so, we believe this is a useful input to our index.
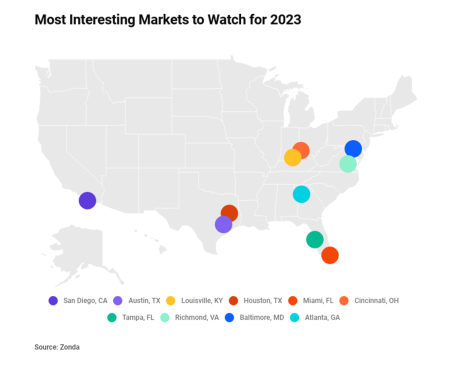
Putting it all together, the map below shows Zonda’s most interesting markets to watch for 2023. Just two metros, Cincinnati and Richmond, Virginia, overlap from our 2022 list, down from six that overlapped from 2021 to 2022.
Atlanta
Atlanta boasts a unique combination of affordable projects in certain parts of the metro paired with strong growth of high-income jobs. These two allow for a lower barrier of entry to homeownership than some other large markets. Even with that backdrop, however, affordability, especially in desirable submarkets with good schools, is already causing the market to slow.
Stats:
- Rent vs. own: The typical mortgage payment is $12 less expensive than renting.
- Percent of homes that are free and clear: 26.9%
- Number of new-home projects below $300,000: 57
- Long-term high-income job growth: 48.5%
- Payment change since the start of 2022: 72.6%
Pros: Diversified economy; a variety of things to do; a cultural hub; and affordable compared with coastal markets.
Cons: Large wealth disparity; early signs of layoffs in entertainment sector; bad traffic with limited public transportation; and urban sprawl.
What our experts say: “Despite a slowdown in activity in recent months, the Atlanta metro market remains resilient and fundamentally sound. New tech- and media-centric industry expansion, complementing consistent corporate and institutional anchors, has spurred steady innovation and investment. Additionally, the region retains its attractiveness to potential future residents given its highly recognized quality of life and ongoing relative affordability. While prospects for 2023 will likely be tempered by generally prevailing economic conditions and cautious sentiment, Atlanta is poised to weather the storm and preserve its position as a top metro in which to live and invest.” —Andrew Wilson, principal, Zonda
Austin, Texas
Austin has long been the most dominant housing market in the country, with homes selling through before construction has completed and wait lists far exceeding the number of homes available, but it recently has cooled significantly. Still though, we find this market interesting given the employment backdrop.
Stats:
- Rent vs. own: The typical mortgage payment is $953 more expensive than renting.
- Percent of homes that are free and clear: 28.8%
- Number of new-home projects below $300,000: 32
- Long-term high-income job growth: 119.4%
- Payment change since the start of 2022: 56.8%
Pros: Market slowed fast, and builders were willing and able to cut prices quickly, allowing for quicker price discovery than other markets; incredible high-income job growth; culture; lifestyle; and relative affordability for migration buyers.
Cons: Market got overheated; speculative buying and building; uncertainty regarding where the market goes from here; traffic buildup with limited public transportation; significant multifamily development; and mortgage payments much higher than pre-pandemic levels.
What our experts say: “Austin was at center stage nationally as the housing market rocketed higher 2020 and 2021 and remains at center stage as one of the markets declining most sharply in 2022. While employment growth remains strong, negative sentiment and affordability concerns have weighed heavily on the new-home market since the spring. The tech outlook is murky over the short term, but the growing presence of companies like Tesla, Apple, Samsung, Oracle, Facebook, etc., are long-term tailwinds for the market.” —Bryan Glasshagel, senior vice president, Zonda
Baltimore
Baltimore ranked high on our index primarily due to a lower than average change in the payment since the beginning of the year. The market lags for high-income job growth, but the variety of employment options from both the government and private sector supports housing demand across different price points.
Stats:
- Rent vs. own: The typical mortgage payment is $168 more expensive than renting.
- Percent of homes that are free and clear: 28.7%
- Number of new-home projects below $300,000: 3
- Long-term high-income job growth: 26.1%
- Payment change since the start of 2022: 63%
Pros: Resilience related to more stable government jobs; relative affordability compared with Washington, D.C.; great accessibility with three nearby airports and a solid interstate highway system; and easy access to things to do.
Cons: Lingering public perception challenges; some safety concerns; and lack of new-home supply.
What our experts say: “Baltimore continues to deal with a dearth of new-home lot inventory. During the COVID period, metro Baltimore’s lot inventory fell to 6.5 months, one of the lowest lot supplies in the country, and community count fell by 63% to 83 projects. Due to low inventory levels, we expect 2023 sales-per-project to remain high due to lack of new-home options. We also think prices will be more stable than national trends. If you own entitled land in metro Baltimore, you are in pretty good shape.” —Dan Fulton, senior vice president, Zonda
Cincinnati
Cincinnati ranks extremely well in our affordability metrics, in terms of both available new homes under $300,000 as well as the price of ownership coming in cheaper than renting. Layer in an otherwise relatively low cost of living and variety of entertainment options, and Cincinnati stands out as an interesting market to watch for 2023.
Stats:
- Rent vs. own: The typical mortgage payment is $127 less expensive than renting.
- Percent of homes that are free and clear: 33.3%
- Number of new-home projects below $300,000: 47
- Long-term high-income job growth: 18%
- Payment change since the start of 2022: 66.8%
Pros: Low cost of living; diversifying economy; museums and sports teams; home to several Fortune 500 companies (including Proctor & Gamble, Kroger, and Fifth Third Bank); and low crime rate.
Cons: Less desirable weather than some other top markets; minimal rail connectivity; and not much growth of high-income jobs.
What our experts say: “Over the past decade, downtown Cincinnati has experienced a large revitalization with microbreweries, farm-to-table restaurants, and entertainment venues. This is on top of the already vibrant riverfront scene anchored by the Cincinnati Bengals and Reds stadiums. Cincinnati is a more under-the-radar market with the city investing in its own success and is a great place to raise a family.” —Cameron McIntosh, vice president, Zonda
Houston
Houston still presents a strong affordability proposition due to the abundant supply, with 268 projects offering homes under $300,000 and likely further downward pressure related to the large number of units under construction and the slowing demand backdrop.
Stats:
- Rent vs. own: The typical mortgage payment is $25 more expensive than renting.
- Percent of homes that are free and clear: 40.8%
- Number of new-home projects below $300,000: 268
- Long-term high-income job growth: 39.1%
- Payment change since the start of 2022: 71%
Pros: Relatively easy regulation to help get more homes built; no state income tax; low overall cost of living; land availability; and culturally diverse.
Cons: Large number of units under construction (Houston had over 20,000 under-construction units as tracked by Zonda, ranking second among major metros behind Dallas); tropical storm/climate risk; heavy dependence on oil and gas industry (though the local economy has diversified); and bad traffic with limited public transportation.
What our experts say: “New-home price appreciation in Houston lagged behind other Texas markets since the start of the pandemic, but an increasing percentage of builders are lowering prices and/or increasing incentives to move product today. While pricing pressure will likely stay in place in the Houston market for some time, the metro, like the rest of Texas, will benefit over the long term from a friendly business climate and relatively low cost of living.” —Glasshagel
Louisville, Kentucky
Louisville stands out because of the reasonable cost of living and the more “under-the-radar” nature of the market. Louisville’s housing market was strong since 2020 but was not making national headlines as the growth was tamer than seen in some other markets. As a result, though, in the face of the national slowing in the housing market, Redfin still considers Louisville to be “very competitive.”
Stats:
- Rent vs. own: The typical mortgage payment is $22 less expensive than renting.
- Percent of homes that are free and clear: 33.4%
- Number of new-home projects below $300,000: 35
- Long-term high-income job growth: 21.8%
- Payment change since the start of 2022: 65.3%
Pros: Relatively affordable; more under the radar than some of the pandemic boom markets; and reasonable tax environment.
Cons: Some extreme weather events; lack of public transportation; high-income job growth has been slow despite a diverse labor force; and higher crime rates.
What our experts say: “Louisville is in an economic renaissance with new business creation, consistent job growth, and billions of dollars of new capital investments. For residents, Louisville offers many of the benefits of larger cities including history, the arts, and entertainment but at a lower price and with less congestion. This traditionally more affordable metro still offers new-home communities priced under $300,000, and those willing to relocate are taking notice. In fact, some potential homeowners are finding other Southeastern markets increasingly expensive and are realizing Louisville is a great choice instead.” —Frank Dix, vice president, Zonda
Miami
Home prices are still appreciating in Miami despite the slowing seen nationally. Even after accounting for rising prices, Miami scored highest on both rent vs. own math as well as percent of homes owned free and clear, indicating the presence of cash buyers and rental prices favoring homeownership. Both of these, plus corporate relocations, could lead to further mobility.
Stats:
- Rent vs. own: The typical mortgage payment is $360 less expensive than renting.
- Percent of homes that are free and clear: 46.5%
- Number of new-home projects below $300,000: 3
- Long-term high-income job growth: 45.1%
- Payment change since the start of 2022: 85.4%
Pros: New corporate relocations; return of international buyers; migration; beaches; no state income tax offering additional affordability; variety of things to do; and a cultural hub.
Cons: Housing affordability; climate risks; cost of living; and bad traffic.
What our experts say: “Despite national economic headwinds, the housing market in Miami continues to remain hot. Strong domestic and international migration, limited developable land, and noteworthy financial firm relocations and expansions continue to fuel housing demand in South Florida.” —Kristine Smale, senior vice president, Zonda
Richmond, Virginia
Richmond ranks highly in our index due to the relative affordability in the metro and a high share of residents that own their homes outright. This midsized market has good accessibility to places like Washington, D.C., to the north and Virginia Beach to the southeast and offers residents a moderate climate.
Stats:
- Rent vs. own: The typical mortgage payment is $177 more expensive than renting.
- Percent of homes that are free and clear: 35.6%
- Number of new-home projects below $300,000: 19
- Long-term high-income job growth: 25.7%
- Payment change since the start of 2022: 68.2%
Pros: Good access to interstate highway system; reasonable job opportunities, particularly in banking and education; younger population; moderate climate; and more affordable than Washington, D.C., or Baltimore.
Cons: More under the radar; public transit is not as developed and accessible as other cities; and less job diversity than some nearby cities.
What our experts say: “Richmond has long been an attractive place to live for its strong culture, solid and diverse economy, and beautiful community designs. The work-from-anywhere trend has expanded Richmond’s market depth for new homes and that will likely continue into 2023 and beyond. This attractive market is not a secret—we are seeing major acquisition activity from new entrants into the Richmond housing market and expect that trend to continue.” —Fulton
San Diego
San Diego, a place often referred to as “America’s Finest City,” offers lifestyle, desirable weather, and a mix of urban, suburban, and coastal settings that attracts tourists and new residents from across the country. Like other coastal markets, San Diego suffers from geographic barriers and high regulatory costs that inhibit new developments. The glaring and longstanding supply and demand imbalance, however, provides a compelling case for longer-term growth for residential building, multifamily construction, and remodeling.
Stats:
- Rent vs. own: The typical mortgage payment is $1,495 more expensive than renting.
- Percent of homes that are free and clear: 27.2%
- Number of new-home projects below $300,000: 0
- Long-term high-income job growth: 29.1%
- Payment change since the start of 2022: 63.9%
Pros: Lack of development prevented cyclical oversupply; relatively large share of high-income and high-wealth individuals; becoming a hub for biotech employment; and low homeownership rate offers an opportunity for more attainably priced homes.
Cons: Outsized impact of higher mortgage rates for home buyers given higher home prices; high housing costs mean huge barrier of entry; high local taxes further the affordability crunch; and lack of developable land.
What our experts say: “Many of the forces that contributed to rapid price appreciation over the past two years remain in place and are helping buoy the market against headwinds—most notably is low inventory. With just 62 active new-home communities, San Diego County is benefiting from continued low levels of new-home supply. Extending into the resale market where there is just two months of detached resale supply, low supply conditions make this a very different market cycle compared with the mid-2000s.” —Stephen Carr, vice president, Zonda
Tampa, Florida
Tampa has been red-hot over the past couple of years and will be interesting to watch in 2023 to see whether demand remains. The market has held up relatively better than some other migration hot spots, but the rapid growth in home prices combined with high interest rates threaten the strength.
Stats:
- Rent vs. own: The typical mortgage payment is $94 less expensive than renting.
- Percent of homes that are free and clear: 42.2%
- Number of new-home projects below $300,000: 24
- Long-term high-income job growth: 56.3%
- Payment change since the start of 2022: 82.9%
Pros: Relatively desirable weather; variety of things to do; no state income tax offers additional affordability; diversifying job market; and access to beaches.
Cons: Expensive relative to itself; and risk of natural disasters and tropical storms.
What our experts say: “Tampa has been one of the top-performing markets over the past several years, largely due to strong high-income job growth fueled by company relocations and accelerated migration from the Northeast and the Midwest. While some submarkets of Tampa are experiencing higher inventory levels and pricing pressure, areas close to the urban core along primary transportation corridors continue to outperform.” —Smale