Over the past five years, the median price per square foot has increased in each of the 50 largest new-home markets in the country, according to Hanley Wood’s research arm, Metrostudy.
Housing’s recovery from the Great Recession is undeniably a factor in the increase of median price per square foot from 2012 to 2017, and the typical factors influencing that number—regulatory costs, the cost and supply of developable land, material costs, and labor—also play a role. However, according to experts in some markets that have experienced the greatest and least degrees of growth in price per square foot, there are other factors influencing square foot price that are unique to their respective markets.
Big Gains
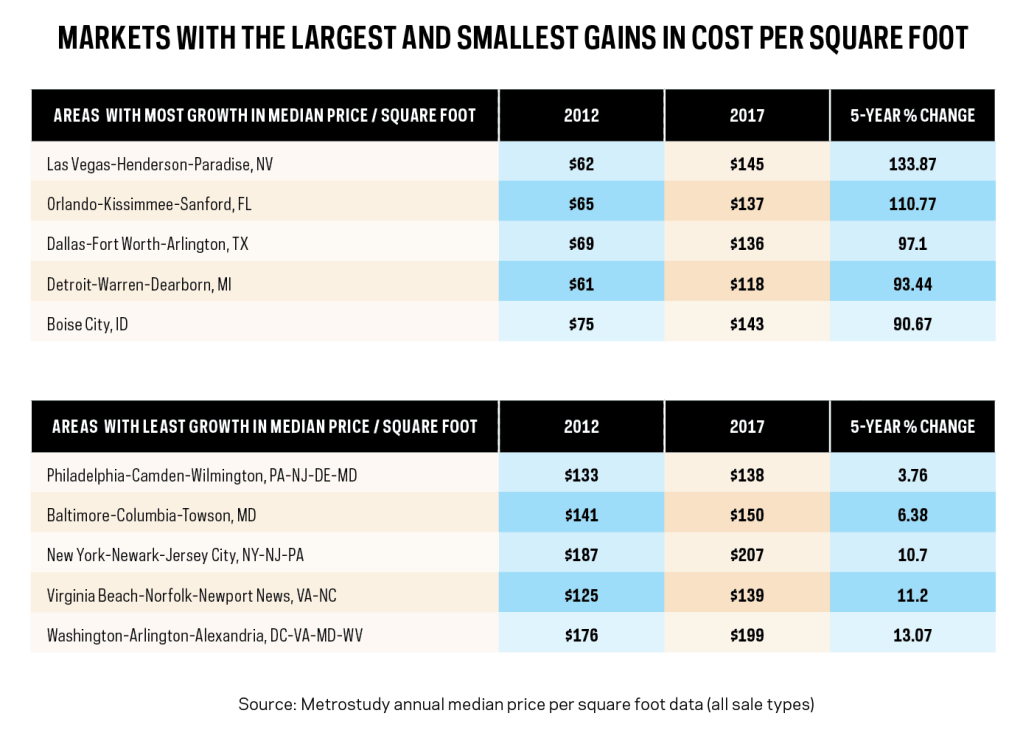
The five markets that posted the largest gains in median price per square foot from 2012 to 2017 were well-distributed across the U.S. The Las Vegas area led the nation’s largest new-home markets with a 133.87% increase in price per square foot, followed by the Orlando area (up 110.8%), Dallas (up 97.1%), Detroit (up 93.4%), and the Boise City market (up 90.7%).
The gains seen in Las Vegas and Orlando are fairly straightforward, as both were among the hardest hit markets in the country during the housing crash. According to Ryan Brault, Metrostudy’s regional director in Las Vegas, the median home price in the market dropped almost 50% from the peak until the market reached bottom around 2012. A major contributor to Las Vegas’ recent increase is that the market has been recovering for only the past five years—most markets hit bottom in 2011, while Las Vegas bottomed out later in 2012.
“Just getting back to reasonable price levels was a big part of it, and more recently, in-migration has really picked up over the past two years,” Brault says. While lot shortages are plaguing many markets across the nation, Las Vegas is also unique because it is surrounded by state and federally owned land. This means that most future growth will be dependent on state land sales, a slow process that will make it difficult for the supply of land available for development to increase to a level sufficient enough to meet that demand, which further supports price growth as the population grows.
In-migration is playing a significant role in Boise City, too, as boomerang buyers are returning to the area and exiting the pricey California and Arizona markets. According to Eric Allen, Metrostudy’s regional director in Boise, this is more prevalent among buyers in higher price bands, but some in-migration is being supported by stable job growth over the past three years. However, the median $143 per square foot in Boise can be most attributed to the diversity of product types offered in different parts of the market.
“Boise is kind of a split market,” Allen explains. “In Ada County, about 50% of production is above $300,000 to $350,000, while in Canyon County, about 75% of production is priced below $300,000.”
Despite the fact that resale inventory is very low and limited primarily to higher budget buyers, pockets of the market are serving entry-level buyers, and a smaller home pushes up that price per square foot easily. So while Boise is among the five most expensive markets for median price per square foot, that number is less demonstrative of a market that is becoming unaffordable, and more demonstrative of a market that is serving multiple different types of buyers, says Allen.
Smaller Growth
In contrast, the markets where median price per square foot increased the least from 2012 to 2017 are located primarily in the northeast region of the U.S., or along the East Coast: Philadelphia (up 3.76%), Baltimore (up 6.38%), New York-Newark-Jersey City (up 10.70%), Virginia Beach (up 11.20%), and Washington-Arlington-Alexandria, Va. (up 13.07%).
In Philadelphia and the New York area, there’s been a major dichotomy between sale type and the growth in median price per square foot over the past five years. In New York-Newark-Jersey City, price per square foot increased 15% for resale homes only, compared with a 42% increase for new homes. The same dichotomy can be seen in Philly, where resale homes saw a 5% increase in median price per square foot, compared with 11% for new homes.
According to Quita Syhapanya, Metrostudy’s regional director for both New York and Philadelphia, the overall growth in price per square foot is trending down due to the influence of significant “shadow inventory” left from the recession in both markets, as well as many lower priced submarkets that have kept the median price per square foot down. In New Jersey, New York, and Pennsylvania, the foreclosure process is among the longest in the country at nearly four years, Syhapanya adds. “The banks are now slowly releasing these REO properties to sell on the market,” Syhapanya explains.
“The banks are careful about how they release them, because if they’re released all at one time, it would shock the market.”
Ben Sage, Metrostudy regional director of the Washington, D.C., area, says his market also has some unique circumstances that have contributed to less growth in the median price per square foot. Although prices have started to rise in the D.C. metro area in 2018, the government sequestration in 2013 cost jobs and confidence, and wages overall have been flat.
“The lingering effect of the sequestration lasted a few years, much longer than I had anticipated,” Sage says