
There’s an interesting dynamic in the housing market right now. The improvement in demand seen so far in 2023 is a welcome surprise to the home building community, but it is being carefully watched by policymakers trying to get inflation under control.
The Federal Reserve is enacting restrictive policy to intentionally slow the overheated economy, and the housing market is a core part of that effort. But so far, data gathered by Zonda as part of its New Home Market Update for January suggests most builders are reporting a stronger-than-expected start to the year.
This uptick in demand is captured in Zonda’s New Home Pending Sales Index (PSI) for January. The PSI was down 5.8% month over month when seasonally adjusted but up 4.3% when nonseasonally adjusted.
While there are some pockets of outperformance where communities are exceeding sales seen at the beginning of last year, the majority remain well below levels seen in 2021 and early 2022. Sales rose nationally in January, but not to the same extent as would be expected given the time of year.
“It has felt like we’ve experienced data whiplash over the past few months as new economic and housing stats have been released,” says Zonda chief economist Ali Wolf. “It’s hard to see the uncertainty clearing anytime soon, so we recommend going back to the basics of understanding market resilience, local supply and demand dynamics, and consumer preferences to guide future developments.”
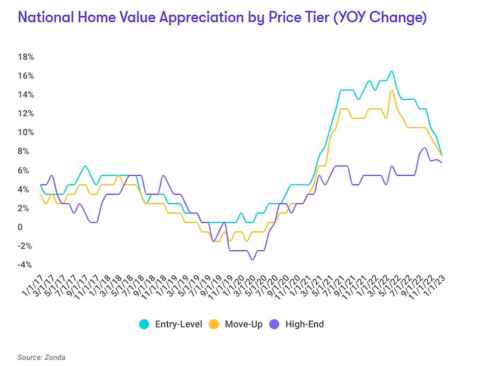
- National home prices increased year over year across entry-level, move-up, and high-end homes, according to the PSI. Prices rose 8.4% for entry-level homes to $336,943, 8% for move-up to $526,718, and 7.3% for high-end homes to $904,410.
- The majority of builders reported holding their prices flat month over month from December to January. Roughly 32% of builders lowered prices, and 12% increased them.
- Incentives are still common in today’s housing market given the lower levels of sales; 57.6% of active projects are offering to-be-built incentives, up from December. The average incentive dollar amount is $13,697, or 4% of the list price.
Zonda’s new-home sales metric counts the number of contract sales each month and accounts for both cancellations and seasonality. This metric shows there were 498,214 new homes sold in January on a seasonally adjusted annualized rate. This was a decline of 6.1% from December and a drop of 37.5% from a year ago. On a nonseasonally adjusted basis, 40,112 homes were sold, 39.5% lower than a year ago but up 2.1% from December.
Total sales volume is down, but some markets appear to have stabilized.
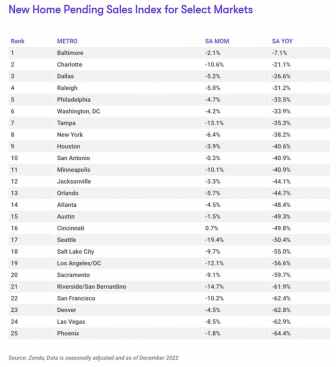
- The PSI failed to grow in any of the select markets year over year, but Baltimore was again the strongest performer.
- The metros that performed the worst year over year were Phoenix (-64.4%), Las Vegas (-62.9%), and Denver (-62.8%).
- On a monthly basis, Cincinnati, San Antonio, and Austin, Texas, were the top performing metros. Cincinnati increased 0.7% relative to December, while San Antonio and Austin were down 0.3% and 1.5%, respectively. Note, these percentages are seasonally adjusted.
Total community count is nearly 30% below pre-pandemic levels, according to Zonda, which defines a community as anywhere with five or more units for sale. There are 13,412 actively selling communities tracked by Zonda, down 6.4% from last year. On a month-over-month basis, the national figure slipped 1.9%.
Meanwhile, national quick move-ins (QMIs) totaled 29,084, up 203.9% compared with last year but 11.7% lower month over month. On a metro basis, all of Zonda’s select markets increased QMI count year over year.
QMIs are homes that can likely be occupied within 90 days. In many cases, builders were willing and able to offer more aggressive price cuts and/or incentives to help sell these homes, and the month-over-month drop captures the effectiveness of that tactic.