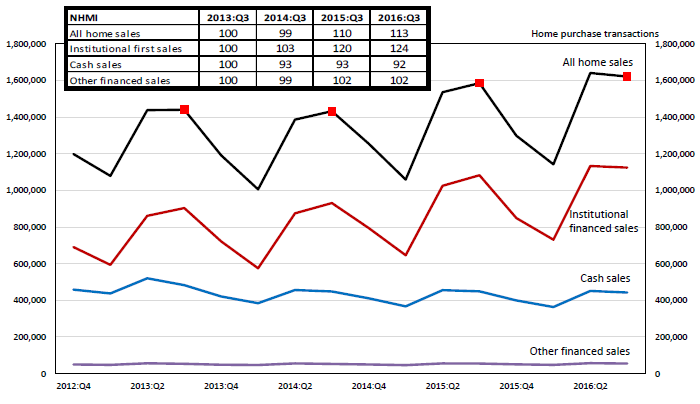
The AEI International Center on Housing Risk’s National Housing Market Index measure of housing demand rose three points year over year in the third quarter of 2016, up to 113 from 110 in Q3 2015. This translates to 1.6 million in total home sale origination volume in Q3 2016, a 2.3% increase in volume from Q3 2015.
AEI presenters Edward Pinto and Mark Fleming attribute this rise in transaction volume to a demand for institutional financed loans, driven by lower mortgage rates, loosening lending, and a decline in international investors. A total of 1.1 million home purchase loans were created in Q3 2016, up 3.9% from Q3 2015 and 24.5% from 2013. Total dollar loan volume also rose, reaching $280 billion in Q3 2016, up 5.3% from four quarters ago and 34.5% from three years ago.
Cash transactions only totaled 440,000 during this period, or 27.3% of all transactions, down 1.4% YOY and 8.4% since 2013. Other financed sales such as seller-carried loans have remained relatively flat over the past three years, making up 4% of all sales with a count of 55,000 this quarter.
The NHMI Purchase Loan Index stood at 124 during this period, up from 120 in Q3 2015. Most of this growth came from GSEs, and primary owner purchase loan demand is growing five times faster than second home or investor demand.
Loans with government backing or guarantee currently make up over 80% of the home loan market. Large banks controlled a 30% share of the GSE purchase loan market in Q3 2016, down from 51% three years ago, while less than 20% of FHA loans were controlled by large banks in the same period, down from 63% in Q4 2012.
Solid job gains, low mortgage rates, and high leverage have maintained real home price growth and kept the national seller’s market going for its 51st month.
At the state level, purchase loan volume is trending upward nearly nationwide. Texas, California and Florida share over a quarter of the nation’s purchase loan market, and the top 25 CBSAs account for 45%. AEI notes that the share of loans made through the FHA and RHS (Rural Housing Service) is higher in states with low home prices.
The NHMI covers 21 million home purchase transactions made between Q4 2012 and Q32016, an estimated 90% of all transactions made during this period. The data is grossed up to cover the entire market.