In the past nine months, new-home demand fell more precipitously than in prior slowdowns. This downward trajectory surprised many industry observers because of a generally strong economic backdrop, up to now. We believe the steep decline owes itself principally to constrained affordability, weaker consumer sentiment around housing, and rising levels of existing-home inventory.
Unit demand for new homes hit a torrid pace during the three years that led up to the July 2005 peak, increasing at a 13 percent compound annual growth rate (CAGR) and dwarfing a 4 percent average over the past 30 years. Average new-home prices rose at a 10 percent CAGR, also above the 7 percent 30-year average. Here’s a drill-down on contributing factors.
Constrained affordability driven by higher interest rates. Since July 2005, the 30-year mortgage rate has risen by 127 basis points, to 6.8 percent. Any time mortgage rates move sharply, there is an inverse and coincident change in demand, which we have witnessed over the last 12 months. This increase, combined with the jump in the average price of a new home, has contributed to a 15-year low in housing affordability, hindering marginal buyers.
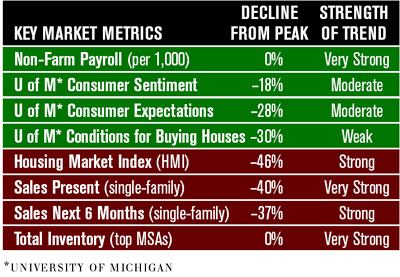
Cautious consumer sentiment. Based on the University of Michigan’s monthly survey of consumer expectations for buying a home, the number of potential buyers who believe it is a good time to buy has fallen 28 percent from peak levels. Amid a deluge of negative media, lower consumer confidence, and affordability constraints, and as prices drift downward on existing housing, buyers are holding off.
Rising inventory levels. As homes take longer to sell, and speculative activity reverses from “demand-positive” to “supply-negative” over the past 12 months, inventory levels throughout the country rose 68 percent, year-over-year. With that said, for the week ending on July 28, of the 50 markets we monitor, 14 had inventory levels below the most recent peak, whereas 36 increased to new peak levels. These three trends converged to create the supply overhang plaguing the market. Still, new mortgage purchase applications, albeit 27 percent below its June 2005 peak, have remained consistent month to month since early February. This suggests that there are buyers, but they’re more likely to be taking advantage of less expensive, existing-home inventory rather than buying new homes. If the overall economy continues to support healthy job formation trends, there should be improvement in this situation, as new-home inventory is absorbed and builders benefit from sell-through at their communities.
Currently, the number of existing homes for sale is at an all-time absolute high of 3.7 million homes, according to the National Association of Realtors. That said, based on the current selling pace, this statistic only represents a 6.8 months of supply. Through year-end, the inventory situation will likely get worse before it gets better, as cancellation rates remain inflated and builders are inadvertently building speculative homes. On the other hand, all of the public builders have dramatically reduced unit delivery targets for 2007, and housing permits have fallen 20 percent from the year-ago peak. Until existing-home inventory begins to be absorbed and home prices stabilize, we do not expect new-home sales to rise.
To identify an inflection point in demand, the challenge is to identify the best leading indicators. Based on our analysis of the past three housing downturns, no individual metric accurately predicts this change.
We are now focused on answering the following questions: Will conditions decelerate nationally from the current pace; if so, how much so before conditions stabilize? Once demand troughs, how long will it take for operating results to reverse? In turn, how quickly will sentiment and share prices react to this change?
Margaret Whelan is an analyst with UBS Investment Bank.
More Bad Than Good The majority of our indicators remain negative, indicating that operating conditions may decline further before they improve. The strength of the trend is based on the frequency that the measure has moved in current direction over a six-week period. Metrics shaded in red indicate a negative trend; green indicates a positive trend.


