Using the U.S. Census bureau’s data on race, minority, and U.S. home ownership, ABODO has laid out the metropolitan statistical areas (MSAs) in which racial minorities were most and least likely to be home owners, and examined changes in the rate of home ownership among white and minority Americans over time.
ABODO also calculated the differences between time that white households would need to save up for a down payment for a home and the time that minority households would need in a given MSA, given the median income disparity between white and minority households.
At the national level, 63.1% of all U.S. Americans are home owners, according to the U.S. Census Bureau. However, out of all U.S. Americans that identify as members of racial minorities on the U.S. Census, only 46% are home owners.
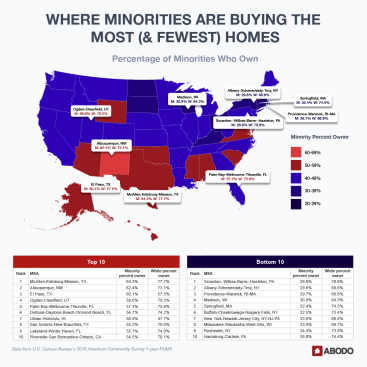
The MSAs where the highest percentage of minorities own homes are in the South, Southwest, and West. Three are in Texas, three are in Florida, and the rest are in California, New Mexico, Utah, and Hawaii. At the state level, all of these states’ minority home ownership levels exceed 45%. New Mexico sports the highest minority home ownership rate at 63.1%, equal to the national home ownership rate for all Americans.
At the city level, McAllen-Edinburg-Mission, Tex. leads the list with 64.3% of minorities owning homes, compared to 77.7% of Caucasians. Minority home ownership outpaces Caucasian home ownership in El Paso, Tex. at 60.1% to 57.5%, and in Urban Honolulu, Hawaii at 56.4% to 47.7%.
Scranton–Wilkes-Barre–Hazleton, Penn. has the lowest percentage of minority home ownership in the country at 28.6%, compared to 70.8% of Caucasians in the MSA and 44.8% of minorities statewide. Most of the MSAs with the lowest minority home ownership rates are on the east coast, with the exception of Madison, Wisc. at 30.8% and Milwaukee-Waukesha-West Allis, Wisc. at 33.9%.
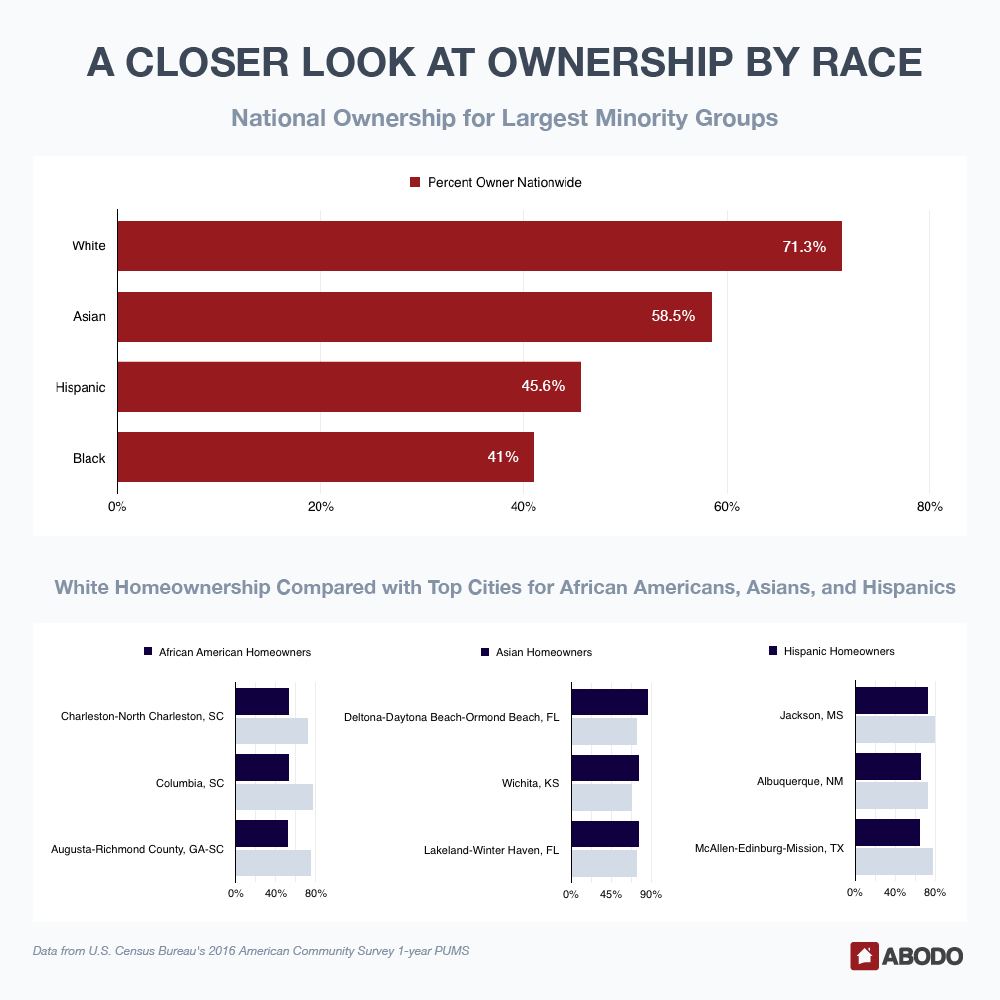
ABODO also examined the home ownership rates of the nation’s three largest minority groups – African-American, Asian, and Hispanic – alongside white home ownership rates. On the national level, 71.3% of Caucasians, 58.5% of Asians, 45.6% of Hispanics, and 41% of African-Americans are home owners.
The three MSAs where African-Americans are most likely to own homes are all in South Carolina. In Charleston-North Charleston, 53.5% of the black population owns homes, along with 53% of the black population of Columbia and 52.3% of the black population in Augusta-Richmond County. Spokane-Spokane Valley, Wash. had the lowest black home ownership rate at 14.9%.
Asian home ownership outpaces white home ownership in the MSAs with the highest percentages of Asian home ownership: Deltona-Daytona Beach-Ormond Beach, Fla. (85.9%), Lakeland-Winter Haven, Fla. (76.2%) and Wichita, Kan. (76.7%). Syracuse, N.Y. has the lowest Asian home ownership rate at 33.3%.
Hispanic home ownership is strongest in Jackson, Miss. (72.8%). Hispanic people are far less likely to own homes on the East Coast, specifically in Massachusetts. In Worcester, Mass.-Conn., only 23.7% of the Hispanic population owns homes, compared to 70.9% of the Caucasian population. Similar trends exist in Providence-Warwick, R.I.-Mass., and Springfield, Mass.
At the national level, minority home ownership rates fell across all three of the nation’s largest minority groups during the ten-year period between 2006 and 2016. Black home ownership fell the farthest, from 46.3% in 2006 to 40.7% in 2016. Asian home ownership fell from 60.3% in 2006 to 58.1% in 2016, and Hispanic home ownership fell from 49.3% in 2006 to 45.5% in 2016. ABODO notes that home ownership declined across the entire population from 67.3% in 2006 to 63.1% in 2016, and white home ownership fell from 74% to 70.2% in the same period.
Notably, African-American, Asian, and Hispanic home ownership rates rose slightly between 2006 and 2007, while national and white home ownership rates fell. ABODO attributes this “blip” to the cheap housing and subprime loans available immediately before the market crash and recession in 2008.
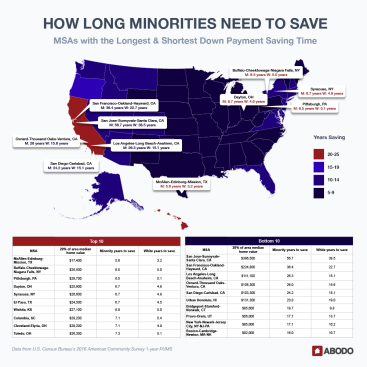
In a previous study, ABODO calculated the time that a household earning the median income in a given MSA would need to save up for a 20% down payment on a median-priced home in that MSA, provided that they set aside 15% of their annual income for down payment savings. In the most expensive MSAs, this wait could take decades.
ABODO has repeated this study based on median incomes by race, and found that minorities may need many more years than Caucasians to save up for a down payment. Median minority income lags behind median white income in all of the country’s 100 largest MSAs. Deltona-Daytona Beach-Ormond Beach, Fla. has the smallest difference in median incomes at $4,700, while Bridgeport-Stamford-Norwalk, Conn. has the largest at $29,500.
“With persistent income disparities between minorities and Caucasians, we found that even in the MSAs that require the fewest years to save up, it would still take minorities years longer than Caucasians to afford a down payment,” says Sam Radbil, senior communications director at ABODO. “And in terms of saving money for a down payment on a home, minorities will struggle the most in some of today’s most popular cities — San Jose (56.7 years to save), San Francisco (36.4 years to save), and Los Angeles (26.3 years to save).”
Minority San Jose residents will need to save for almost 20 more years than white residents, who will need an estimated 38.5 years to afford the area’s $400,000 median down payment. All of the bottom five cities for estimated saving time are located in California, and in all of these cities minorities need to save at least nine years longer than Caucasians. Minorities in McAllen-Edinburg-Mission, Tex. have the shortest wait at 5.6 years, compared to 3.2 years for white households.
The above data was calculated using the median home value for all home owners in a given MSA. In all but two of the country’s largest MSAs, the median value of homes owned by minority households is less than 100% of the median home value of homes owned by white households. In Albany, N.Y., minorities’ median home value is 102.1% of whites’ median home value, while, in San Francisco, minority median home values are only 43.5% of white home values.
ABODO notes that the report does not take into account the many other factors that impact home ownership and financial security based on race, including education, occupation, and immigration status. The study also highlights a recent report by the Insight Center for Community Economic Development, which says that minority children are four times more likely than white children to remain poor if they are born poor.
Despite this, ABODO concludes that its findings are “consistent enough to be able to point out a few clear trends.” There is a basic income disparity between minority and white U.S. citizens. Minority households, especially African-Americans, are significantly less likely than white households to own homes. They must save up for years or decades longer than white households in order to afford a down payment, and their homes are often worth less than the median white home value in their area.