
Editor’s note: This article is from the Zonda National Outlook (ZNO). The ZNO is Zonda’s subscription report focused on the economy and housing market nationally and locally.. You can learn more here.
Consumer spending is the cornerstone of the U.S. economy; it acts as the primary driver of the demand side of the supply and demand equation and typically comprises around 70% of all economic activity. According to the Bureau of Economic Analysis’ most recent figures, consumer spending grew by 2% in early 2024. While this is a downward revision from the previous estimate of 2.5%, it still helped fuel the first quarter’s 1.3% GDP growth.
Consumer spending patterns are heavily dependent on wages, but other factors play a crucial role, including interest rates, inflation, consumer confidence, savings, and access to financing. These factors are interdependent, as seen in the increased debt taken on by U.S. households recently attempting to manage current high interest rates and inflation.
Understanding debt burdens, delinquencies, and age disparities is essential to gauge the health of the U.S. consumer. This report draws on data from the New York Fed’s Consumer Credit Panel.
The Basics
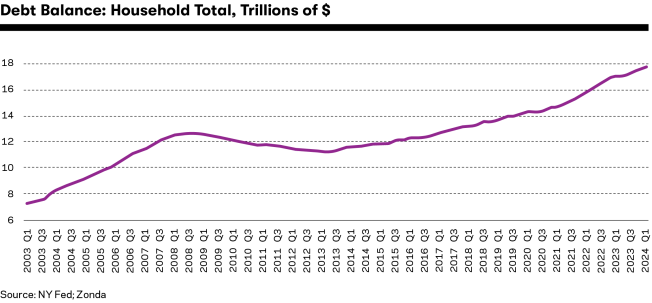
Since the end of 2019 and the onset of the pandemic, U.S. household debt has grown by 25%. According to the New York Fed’s data, aggregate debt grew by 1.1% quarter over quarter to $17.69 trillion to start this year. At first glance, current levels appear alarmingly high.
Zonda
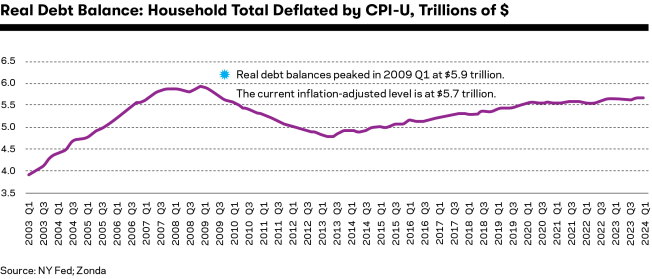
If you adjust the debt balances for inflation, however, levels look significantly more reasonable. Real debt, which is debt adjusted for inflation, totaled $5.7 trillion in the first quarter. While this is still $180 billion more than pre-pandemic (fourth quarter 2019) levels, it, thankfully, remains below the historic peak of $5.9 trillion in 2009’s first quarter and is growing much slower than non-inflation-adjusted debt.
While adjusting for inflation allows for more accurate comparisons over time, it may obscure the actual burden on households. More on that later.
Zonda
Breaking Debt Down
A stigma generally exists around having debt, but not all debt is equal or necessarily bad. As the saying goes, “It takes money to make money,” and, when used responsibly, debt can be a powerful tool to build wealth and help people prepare for the future.
For example:
- Mortgages allow individuals to purchase homes, providing housing security and growing net worth.
- Student loans can be beneficial, as the Bureau of Labor Statistics has consistently found that adults with a bachelor’s degree or higher experience lower unemployment rates and higher median incomes.
- Even credit cards, the most notorious of loans, can help consumers build a credit history and obtain rewards through points and promotions.
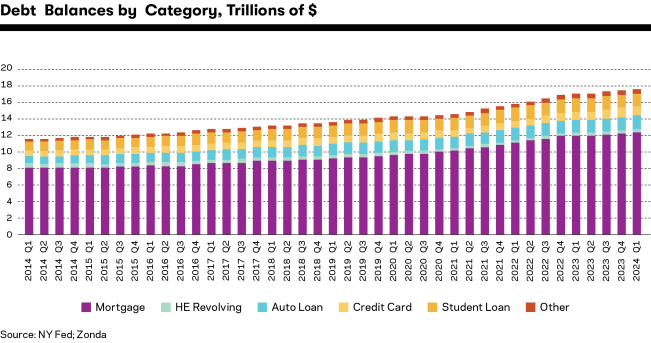
Consumer debt can be broken into two major categories: housing and non-housing.
Housing Balances
These balances, which include mortgages and home equity lines of credit (HELOC), accounted for 72% of aggregate household debt in the most recent survey. This makes sense as the dollar value of mortgages are much higher than standard credit card purchases, for example.
- Mortgages comprised the majority of consumer debt (70%), totaling $12.44 trillion unadjusted for inflation. Mortgage balances increased by $190 billion quarter over quarter (1.6%), the highest volume of any category.
- HELOC were the smallest share of household debt. They increased by $16 billion (4.4%) quarter over quarter, reaching $376 billion in the most recent data. This is 18.5% higher than the category’s trough in the third quarter of 2021.
Non-Housing Balances
These balances, which include credit cards, auto loans, student loans, and other loans, fell by $22 billion (-0.4%) in the first quarter.
- Credit card balances totaled $1.12 trillion in the most recent survey and represented 6.3% of all U.S. household debt. This was a 1.2% drop quarter over quarter, but levels were up 13.1% from last year and 20.3% from 2019. However, after adjusting for inflation, real credit card debt levels are down, albeit slightly (-0.7%), from 2019.
- Auto loans represented the second-highest debt category for U.S. households, comprising 9.1% of all debt. Auto loan debt has trended up since the second quarter of 2020 and continued its upward trajectory to $1.52 trillion in the first quarter. That said, a different picture emerges when auto loan debt is adjusted for inflation: It increased quarter over quarter (0.3%) but has fallen slightly year over year (-0.2%) and since 2019 (-0.5%).
- Student loans were just below auto loans in their share of household debt, comprising 9% of all debt. They remained relatively level in the most recent data, dipping by just $6 billion quarter over quarter to $1.6 trillion.
- Other household debt, which includes retail cards and other consumer loans, was 3.1% of total debt and fell by $11 billion quarter over quarter.
Important, debt balances and types varied by age cohort in the most recent release.
Middle-aged adults (40 to 59) had $4.6 trillion of debt, the most of any age cohort, largely due to high homeownership rates and mortgage loans. All the older cohorts (40-plus) saw debt volume grow from the fourth quarter of 2023 to the first quarter of 2024, with the steepest growth (+12.6%) seen for those 70 and older. Simultaneously, the two younger cohorts saw debt balance drop by 16.4% (ages 18 to 29) and 3.7% (ages 30 to 39).
Zonda
The Dark Side of Debt
Problems with debt arise when consumers take on more than they can repay, leading to missed payments or delinquencies. This inability to pay is particularly problematic in today’s environment, where the Fed’s rate hiking cycle, which began in 2022, has pushed interest rates to a 23-year high of 5.25% to 5.55%. These rate increases trickle down to consumers, raising borrowing costs and making it harder to escape debt.
The latest survey showed the household aggregate delinquency rate rose by 0.1% year over year, with 3.3% of all debt in some stage of delinquency. Although the share of delinquent loans remains below pre-pandemic levels, the first quarter marks the fifth consecutive quarter where delinquent loans have either grown or remained stable. This is a notable departure from the downward trend in delinquencies seen during the early days of the pandemic when student loan payments were paused and people were staying home, saving more, and paying off their debts. Further, the aggregate delinquencies look healthy, but certain subsets look alarming.
Delinquencies are measured by the Fed in two ways: loans that are delinquent for 30-plus days and, if those balances go unpaid, serious delinquency at 90-plus days. Overall, only 1% of balances 30-plus days were delinquent and 1.9% of those 90-plus days. For context, the levels were 1.1% and 3.1%, respectively, in 2019 and 2.1% and 3.6% during the peak of the Great Financial Crisis.
The ability to manage debt varies by age. Older individuals are more likely to make their payments due to greater financial literacy and stable economic situations. However, serious delinquencies grew across all age cohorts in the first quarter, with the most dramatic growth among those ages 18 to 29.
Of the credit types, the two subsets flashing red are credit card and auto loans. This is important to watch as the share of credit card and auto loan debt transitioning to serious delinquency was highest for the youngest age cohort.
- New credit card delinquencies (30-plus days overdue) have reached their highest level since the 2010s. The share of newly delinquent credit card loans grew from 8.5% to 8.9% quarter over quarter but remains 4.9% lower than the peak in the fourth quarter of 2009. However, credit cards saw the highest share of loans move to serious delinquency of any loan type in the most recent survey, with 6.7% of credit card loans transitioning into 90-plus days overdue.
- New auto delinquencies have shot up since 2022. The share of auto delinquencies that were newly delinquent grew to 7.9% in the first quarter—up 0.3% quarter over quarter and 1.3% year over year. The share of newly delinquent auto loans has been climbing since the end of 2021 but has yet to reach the 10%-plus seen during the Great Recession. The share of auto loans that transitioned to serious delinquency also grew by 2.8%—up 0.1% quarter over quarter and 0.6% year over year.
While it can be easy to miss payments due to forgetfulness or poor budgeting, the growth in delinquencies indicates that select households might be overly reliant or overextended on credit. This is highlighted by the current median credit card utilization rate (the ratio of the amount of credit being used versus available): 13% for borrowers without delinquencies compared with 90% for those with new delinquencies.
The dangers of debt become apparent when households fall into a cycle of borrowing more than they can repay. This vicious loop leads to immediate stress and has long-term negative effects on future borrowing potential.
For now, inflation-adjusted debt levels look reasonable compared with history, and most borrowers who take on debt are paying it back. Areas of concern exist, though. We are monitoring potential increases in delinquency rates, particularly among younger borrowers and those utilizing credit cards and auto loans. If more consumers fall behind on these payments, spending could falter, potentially causing a pullback in the economy.
Sarah Bonnarens, senior manager of economic research at Zonda, contributed to this article.