They say you can only manage what you can measure.
In a sector that’s chock-full of indexes, data points, metrics, benchmarks, and measures of measures of every dimension you can think of, here’s a new one whose intent is a better mousetrap for understanding real-time local home-buying payment power.
As in who’s got it for homes and properties currently on the market, and who doesn’t.
Payment power describes a relationship. It correlates a local area’s real household earnings across a range of income percentiles with real, actively-for-sale homes and properties in that market, so that you see the number of people capable of carrying the principal, interest, taxes, and insurance payments on standard mortgages for the listed for-sale properties.
And the [growing] number of people or households incapable of doing so.
Payment power is dynamic, shifting constantly due to changes to economic and financial conditions–a newly-established employer, for instance, that offers lots of high-paying new jobs in a community–as well as changes to the supply of homes for sale at varying price ranges in a market, as well as changes to interest rates. This year especially, the T in PITI–for taxes–becomes materially important, at least in some local markets, as property tax deduct-ability has been cut by the Tax Cuts and Jobs Act of 2017.
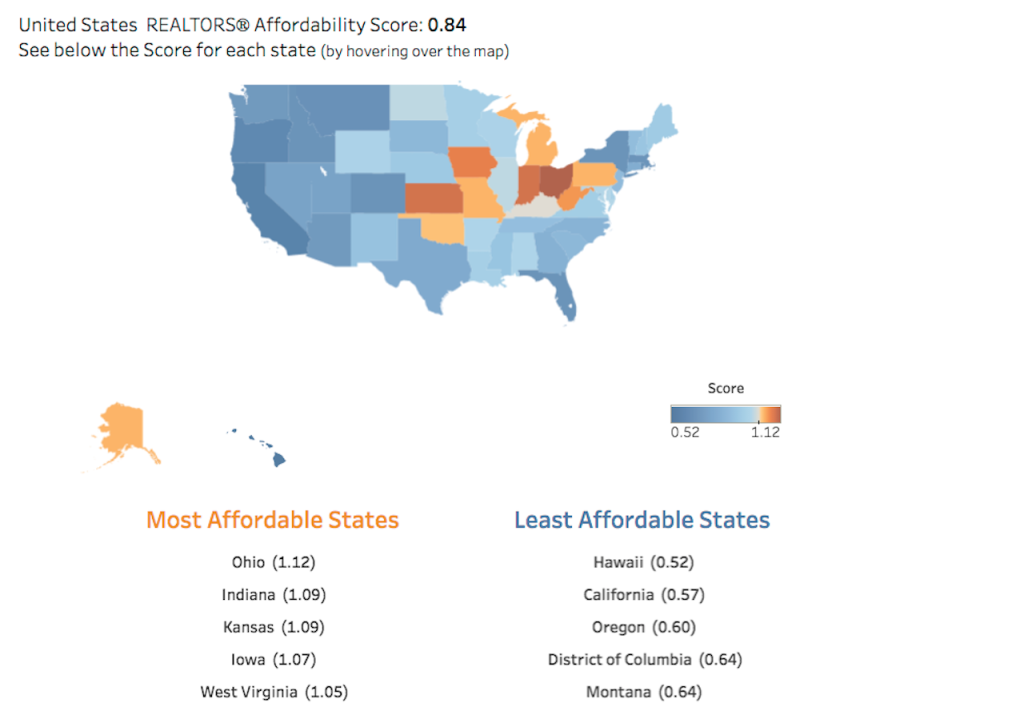
The National Association of Realtors® and realtor.com® have created the Realtors® Affordability Distribution Curve and Score in which a score of one or higher generally suggests a market where homes for sale are more affordable to households in proportion to their income distribution.
The resulting data points can serve as a veritable Geiger Counter for enterprising developer/builders, particularly those whose product and community portfolio includes offerings the resale market has left wide open for the taking–mostly on the lower end of the price spectrum. From realtor.com’s Clare Trapasso:
“The lack of entry-level [home] supply is putting affordability pressures on too many buyers—especially those at the lower end of the market where demand is the strongest,” NAR’s Chief Economist Lawrence Yun said in a statement. “Wages are growing, which is welcome news for prospective buyers, but prices are increasing at a faster rate.”
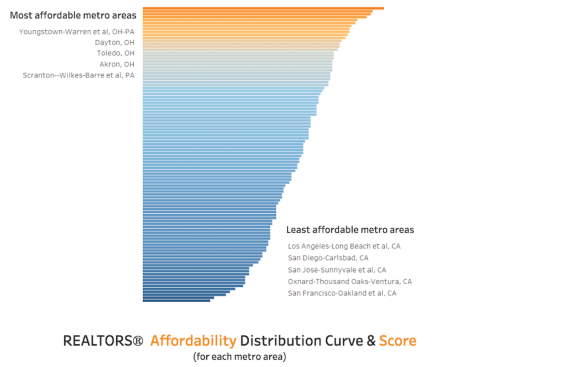
The report maps the metros where payment power is greatest and where there’s the widest discrepancy between household income percentiles and available for-sale inventory. Marry that up with some of BUILDER sibling Metrostudy‘s precision submarket analysis and you’ve got very strong viability decision support to pencil land costs to your [internal rate of return] hurdle rates for product types, price ranges, and community investment.
As land acquisition strategy shifts toward greater focus on asset-lighter, just-in-time take-downs, dynamic measures that match real people, with real household incomes, with real availability–or lack of it–of for-sale inventory become one of the only sure ways to manage your way beyond the next cyclical downturn and upswing.