Pictures tell us stories.
What story does this series of pictures tell?
Here, we have a picture, from the well of this past week’s housing data releases, of new home prices–average and median– that came with the Census Bureau’s New Home Sales for August.
Here’s a picture, from the same source, of how new home sales divide up into quintiles. You’ll note that the bottom two quintiles, which contain new homes sold for less than $200,000, add up to about 12% of the new home total.
And here, from Zillow, is a chart that plots an ever-wider gap between what it costs for a resale home vs. a new home. Currently, there’s a 27.3% premium for a new home vs. a used one.
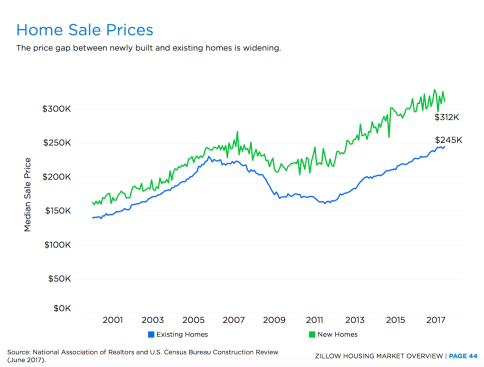
Source: Zillow, June 2017
This gap, which shows that, to buy a new home, it costs some $67,000 more than it does to buy a resale, may help explain several other data points, including this one below, which shows that existing home sales volume eclipses new home sales at a rate of nearly 10 to 1. It also may help explain why demand for rentals–multifamily and single-family–and living in mom and dad’s basements.
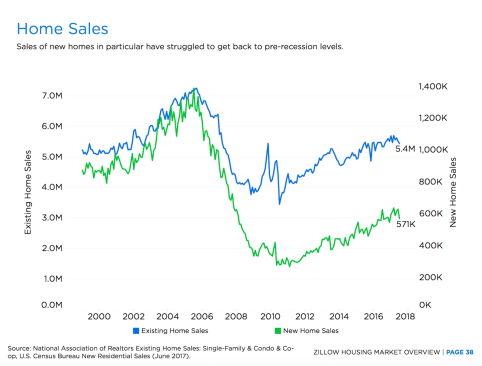
Source: Zillow, June 2017
On a per square foot basis, here’s some dumbed-down math to make a point. If you take 2,600 sq. ft. as the average new home size, and compare that same sized existing home, buyers of new homes are paying $120 per square foot, whereas buyers of existing homes are paying $94 per square foot, a $26 differential. And–allowing for the fact that new homes are mostly better, freer of need for repairs, and more efficient to operate–why?
Explanations for this phenomenon range across a spectrum of viewpoints, mostly depending on whether or not you’re one of the ones trying to make a living selling new homes to people who are otherwise buying old ones, or renting, or squatting in their parents’ homes.
One explanation is that there’s demand enough in the upper two quintiles of chart No. 2 above, to run a good solid business, with healthy gross margins. Fair enough. That would explain the fact that many large home building players have been slower to the draw on their entry-level focus than might have been the case coming out of other downturns.
In a far-more regulated financial environment, where mortgage lending operated in lock-down mode for a few years and even former Fed chief Ben Bernanke was getting turned down on an attempt to borrow money for a home, focusing on discretionary buyers, ones who could pay a lot of cash and not blink, was entirely fitting.
The other reason given for the big pendulum swing to higher new home prices is, broadly, the government. Mostly local government, but national policy, regulation, and code doesn’t get off the hook here.
As this piece from National Association of Home Builders economist Paul Emrath notes, $6.50 of the $26 per square foot difference between new home prices and existing home prices owes to regulations imposed by government at all levels, and $3.90 of that $6.50 traces to land use regulation, fees, hook-up charges, permitting, and such.
Using these broad-stroke rough estimates, people who buy new homes pay almost $20,000 more for homeownership than people who buy resales for reasons strictly to do with land use fees, taxes, etc.
Now, there should be “opportunity area” here for a renegotiation–with town officials, voters, and other local stakeholders–in how much the new-home buyer should pay on his or her home price to subsidize new investment infrastructure, schools, parks, services, and other obligations to local governments. No reason new-home home buyers shouldn’t contribute toward adding the services, infrastructure those new communities will require. What’s clear is that localities are charging these new home buyers a disproportionate amount to underwrite the expenses longer-time residents incur.
On a monthly payment basis, this comes out to hundreds of dollars of difference, and household disposable income growth simply does not support that big a difference.
Still, setting aside that $20,000, there’s another $47,000 dividing new home median prices from existing homes.
Allowing for say a 20% premium, including the layer of costs government at all levels adds, our guess is that the sweet spot of price elasticity–depending on the market–will be in an area between $270,000 and $290,000.
When new home builders’ entry-level programs fully kick in over the next 12 to 24 months, we’ll probably see median and average new home prices trail in that direction.
That will create an entirely different picture for housing. Some firms look at the first and second quintiles in chart No. 2 above and see a golden opportunity.