Affordability is one of the key metrics in housing. Traditional measures make assumptions based on home prices and local incomes. Those metrics, however, fall short now that the pandemic has changed how and where some people live. Enter the Zonda Affordability Ratio (ZAR), a new metric that reflects the true state of housing affordability accounting for the work-from-home economy.
The impact of increased migration on the real estate market has been widely reported. Some individuals, generally from higher-cost metros, took the opportunity to move over the past couple of years. Others had already moved before the pandemic but chose to rent before buying. For those renters, the changes brought on by the virus accelerated their shift to homeownership.
What is not widely understood is that when people move and keep their existing job, their income data generally stays in the location of their employer. For example, if someone is working for a California company and relocates to Nevada but retains the same job, their income remains coded in California.
Traditional affordability metrics do not factor in this important data, and this is where the ZAR steps in. The ZAR was created to show the “true” affordability ratio by considering both local incomes as well as the incomes of individuals in the five markets from where buyers are relocating. The ZAR is customized to each metro and shows the percentage of households that can afford the median-priced home.
It’s important to note that while the ZAR is higher compared with the non-adjusted affordability index for many markets due to the previously unreported impact of out-of-town shoppers, it doesn’t mean housing affordability is improving. In fact, we are at a point where the benefits of the low interest rates on the monthly payment are getting offset by the rapid runup in home prices since mid-2020.
Further, affordability metrics generally mask the impact on lower-income home shoppers. For example, median prices in a metro include A through F locations. Individuals looking to buy into a good location with excellent schools will run into a bigger affordability challenge than the market average suggests. Below you will find the ZAR as of this month, along with notable highlights:
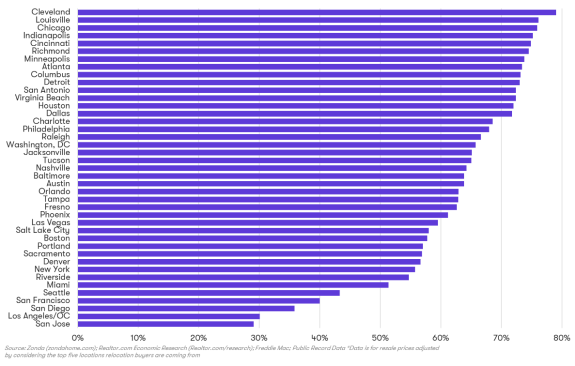
• High ratio meets consumer confidence. Cleveland; Louisville, Kentucky; Chicago; Indianapolis; and Cincinnati are the top five markets for the best affordability across the country as these markets still offer homes priced under $300,000. While the Midwest stands out as the most affordable region in the country, Zonda’s division president survey captures an important point: consumer confidence. Midwest shoppers are showing some hesitancy around how much prices have risen and how quickly.
• Biggest movers. Affordability in Fresno, California; Tucson, Arizona; and Sacramento, California, improved the most following the income adjustment. The top shoppers hail from Sacramento for Fresno, Phoenix for Tucson, and San Francisco for Sacramento.
• In-state. Not every market is driven by out-of-state shoppers. For example, San Antonio’s ZAR percentage was lifted mostly by other markets in Texas, including Austin, Houston, and Dallas.
• California. Four of the five markets with the worst affordability are in California. Restricted land supply, high land prices, strict regulation, low inventory, and perennially strong demand keep home prices high in Northern and Southern California. However, many in the Bay Area working for tech companies, for example, have shares that are supplemental to their base salary.This means that the affordability is higher for some than the data suggests.
Zonda Affordability Ratio*
The ZAR is important because builders have seen the direct impact of relocation shoppers. For example, throughout 2021, builders in Zonda’s monthly division president survey cited move-up shoppers as their most active followed by first-time and relocation. Affordability holds the key to the success of the housing market over the next few years. With the ZAR, Zonda can now provide the most comprehensive picture of this critical metric on a regular basis going forward.