
As we head into 2026, employment is playing a larger role in shaping where housing demand holds up and where it doesn’t. The most recent national labor market data showed an increasingly uneven employment picture: the economy added a modest 64K jobs in November after a significant loss in October, while the national unemployment rate climbed to its highest level in years. These mixed signals reflect both slowing job creation and rising unemployment, especially among younger workers, even as sectors like health care continue to add positions.
At the same time, downside risks are becoming more visible. According to Challenger, Grey, & Christmas’s most recent report, employers have announced more than 1.1M layoffs in 2025 through November, concentrated in government, technology, retail, and services. This marks the highest level of layoffs since the pandemic and has raised new questions about how employment pullbacks will impact local economies and, by extension, housing demand.
Taken together, there is no doubt that the current combination of slower hiring, layoffs, and rising unemployment will carry significant implications for the housing industry. Employment strength underpins buyer capacity, supports income growth, and ultimately determines whether today’s comparatively lower interest rates will be able to translate into actual sales activity. So, as national and local labor market conditions cool, the link between employment health and housing performance is becoming increasingly important.
Employment Markets to Watch (MTW) Index
Over the past five years, Zonda’s annual index has spotlighted markets based on factors such as entry-level affordability, luxury appeal, and relative growth potential. In 2026, our focus shifts again, this time to employment. As companies recalibrate hiring plans, workers reassess relocation decisions, AI adoption accelerates, and competition for talent reshapes local labor markets, employment now sits squarely at the center of the housing story.
Against this backdrop, Zonda’s Employment Markets to Watch Index offers a forward-looking view into which markets are best positioned from an employment standpoint to support economic and housing demand in 2026. Rather than focusing solely on headline job counts, our proprietary index highlights markets where employment growth, capital investment, and demographic momentum intersect to influence future housing demand.
An important caveat before we proceed: this is first and foremost an employment index. This means labor market metrics carry the most weight, with a small set of housing indicators included mainly to test if employment strength is translating into healthy housing conditions. As a result of this, a strong ranking in the 2026 index doesn’t automatically imply equally strong housing fundamentals. Also note that, even in the most stable environments, employment data tends to lag, meaning recent layoff announcements and workforce reductions may not yet be fully captured. Where appropriate, we made qualitative adjustments to account for this.
One final nuance to keep in mind is that a strong ranking can reflect two different dynamics: genuine local momentum or relative strength in a softening national environment. As labor market conditions cool unevenly, some metros move up the list not because they are accelerating, but because others are slowing. In that context, a market “outranking” its peers signals resilience rather than outright outperformance—an important distinction when translating employment trends into housing strategy.
All that said, employment will be one of the defining forces shaping housing in 2026. The metros topping this year’s MTW list are those where job growth, demographic trends, and income dynamics are likely to continue supporting demand across price points and product types.
What goes into the Employment Markets to Watch Index?
Before diving into the top markets, let’s take a look at how the sauce is made. We evaluated Zonda markets with 2024 U.S. Census populations of 750K+ using a comprehensive set of indicators spanning demographics, macroeconomic fundamentals, and housing demand.
As noted above, the index is intentionally employment-focused, with select employment and labor inputs receiving the greatest weight. Key metrics include the following:
- Total nonfarm employment. Growth was examined both year-over-year and from 2019 to measure overall economic momentum. Markets that consistently add nonfarm jobs tend to see stronger household formation and deeper buyer pools.
- High-income employment. Growth was examined both year-over-year and from 2019. Tracking job creation in the traditional white-collar industries (information & technology, professional & business services, and financial activities) is important as they are most tied to new-home purchasing power.
- Health care employment. The index included health care’s year-over-year employment growth, as well as its share of total nonfarm employment. As one of the most reliable job engines in the country, the industry offers steady incomes and has experienced the headline-making layoffs seen in industries like tech and government. These dynamics support long-term housing demand across all stages of the cycle.
- Labor force. We examined growth both year-over-year and since 2019 in order to determine whether a market is attracting and retaining workers. An expanding labor force often signals healthy migration trends and a strong foundation for future household formation, which are both key ingredients for housing demand.
- Median household income. The index included current 2024 values, the share of households earning $150K+, and growth since 2019 to measure the financial capacity of local buyers. Higher incomes help offset affordability constraints and allow households to qualify for higher monthly payments.
- Educational attainment. The share of residents age 25+ with a Bachelor’s degree or higher serves as a proxy for skill depth and future income growth potential. Higher educational attainment is heavily correlated with stronger earnings, which reinforces labor market fundamentals, as well as housing demand.
- Manufacturing investment volume. The index incorporated announced manufacturing investment from the White House’s ‘Investing in America’ report released in early 2025 to capture forward-looking economic momentum. Manufacturing has become a focal point amid renewed onshoring efforts, with large-scale commitments generating direct jobs as well as additional employment downstream. While increased automation and AI adoption could lead to longer-term labor risks in markets heavily reliant on the industry, manufacturing investment was still treated as a net positive in the index.
- H1B visas. Looked at 2024 filings, which measure the depth of specialized, high-skill labor. These workers often rent initially but represent future buyers with strong income trajectories and longer-term local commitment. That said, due to the current risk related to this cohort, a high H1B visa filing was ranked as negative forward-looking metric.
- Fortune 500. Looked at headquarter locations for the 500 largest corporations in the U.S. by total revenue. Corporate hubs tend to bring high-paying jobs, attract top-tier talent, boost local tax revenue, and drive investments that have ripple effects across local economies and housing markets.
We also incorporated a limited set of key housing market indicators to distinguish between markets where strong employment is supporting healthy, sustainable new home demand and those facing housing headwinds from affordability pressures or slower sales. Housing inputs include:
- Payment-to-income ratio. We looked at the current payment-to-income ratio and how it has shifted relative to 2019. Looking at both of these helped to identify markets where affordability has meaningfully tightened, along with those where income growth has remained more aligned with rising monthly payments, suggesting affordability pressures may be less of a headwind.
- Sales rate. To evaluate demand momentum, we looked at year-to-date 2025 average sales rate and compared it to the same timeframe in 2023. This comparison highlights how builder performance has shifted over the past two years, a period defined by rate volatility, increased incentive usage, and shifting buyer behavior.
Together, the metrics listed above capture the strength, composition, and trajectory of local job markets, filtered through a housing lens. The index highlights metros where employment fundamentals are on more solid ground and positioned to support, and potentially even accelerate, housing demand across product types and price ranges.
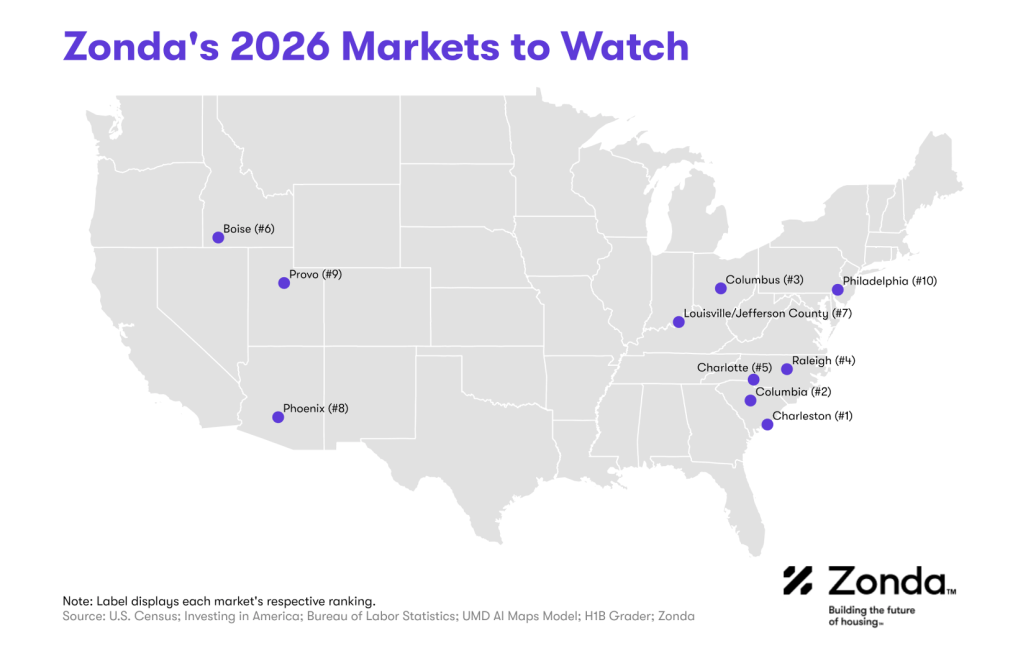
Markets to watch
Here’s a look at the Top 3 markets. A full report can be found here.
- Charleston. Charleston was this year’s employment MTW, ranking highly in both short- and long-term high-income and total employment growth. These gains are being driven by a diversified base: health care employment continues to expand, while advanced manufacturing, including aerospace and automotive suppliers, remains a key anchor for job creation.
At the same time, the region’s tech ecosystem is gaining traction. According to a recent Charleston Digital survey, half of local tech firms added jobs in 2025, and roughly 40% expect to continue expanding in 2026. While rising H-1B visa costs pose risks for some tech-heavy markets, Charleston’s tech workforce appears more domestically oriented and did not register elevated H-1B exposure.
Beyond job creation, Charleston’s enduring appeal to both retirees and young professionals continues to deepen the local labor pool. The metro ranked third among markets in the analysis for labor force growth since 2019, as its quality of life, coastal setting, southern charm, and economic diversity continue to attract new residents.
Stats at a glance:
- YOY employment growth: 2.5%
- YOY high-income employment growth: 3.3%
- Share of households making $150K+: 26.5%
- Labor force growth since 2019: 16.7%
- Share of population aged 25+ with a Bachelors+: 43.1%
- Current median existing home payment to income ratio: 35.7%
Pros: The market is supported by strong employer diversification, a desirable coastal lifestyle, and a growing tech ecosystem. Durable migration inflows and broad multi-generational appeal help underpin long-term demand.
Cons: Elevated weather risk is pushing insurance costs higher, while land constraints in premium coastal areas are driving market bifurcation. Seasonality, tourism-related congestion, and a rising cost of living also weigh on the market.
2. Columbia. Columbia’s employment profile is anchored by stability rather than rapid acceleration. As the state capital and home to major healthcare systems and the University of South Carolina, it benefits from a large institutional employment base that tends to be more resilient during periods of economic cooling. This foundation has supported both total nonfarm and high-income employment growth, even as hiring has slowed elsewhere.
The region’s business environment further reinforces that stability. Competitive taxes, incentive programs, and lower operating costs continue to attract employers across professional services and back-office functions, helping retain talent and support population inflows. From a housing standpoint, incomes and costs remain relatively aligned, keeping affordability more intact than in many faster-growing Southern metros.
Stats at a glance:
- YOY employment growth: 1.2%
- YOY high-income employment growth: 2.8%
- Share of households making $150K+: 17.3%
- Labor force growth since 2019: 10.2%
- Share of population aged 25+ with a Bachelors+: 38.9%
- Current median existing home payment to income ratio: 27.3%
Pros: Columbia’s status as one of the nation’s lowest corporate tax environments and its high overall affordability make it attractive for businesses and residents alike. Its central location with strong connectivity, including access to four major airports, boosts regional accessibility, while its identity as a vibrant college town adds cultural energy and a steady talent pipeline.
Cons: A smaller urban amenity base, more limited infrastructure, and hot, humid summers can limit broader appeal.
3. Columbus. The only non-Carolina market to crack the top 5, Columbus remains one of the more closely watched employment markets heading into 2026 as momentum continues to build around the region’s emerging semiconductor ecosystem. While Intel has announced workforce reductions elsewhere, it has reaffirmed its long-term commitment to Ohio and its Ohio One campus, reinforcing Columbus’ role as a strategic manufacturing hub amid broader hiring pullbacks.
Beyond Intel, Columbus benefits from a strong agglomeration effect, with suppliers, logistics operators, and related technology firms positioning nearby. The region’s large university presence continues to feed the talent pipeline, while steady in-migration supports both labor force growth and housing demand.
Stats at a glance:
- YOY employment growth: 1.3%
- YOY high-income employment growth: 2.8%
- Share of households making $150K+: 23.1%
- Labor force growth since 2019: 6.2%
- Share of population aged 25+ with a Bachelors+: 41.3%
- Current median existing home payment to income ratio: 25.9%
Pros: Columbus is undergoing a meaningful economic and cultural identity shift, anchored by an expanding high-income job base and the strong multiplier effects tied to Intel’s Ohio One investment. Growing investment in retail, food, and urban amenities is reinforcing the market’s appeal and reshaping long-term employment and housing demand.
Cons: Rapid growth is testing infrastructure capacity and public services, while rising costs could pressure affordability over time. Seasonal climate variability may also limit broader migration appeal relative to Sun Belt peers.
The list above reflects a shortened selection from Zonda’s full Employment Markets to Watch analysis published in the National Outlook.
Sarah Bonnarens co-authored this article.