The creative class, made up approximately 7.9 million Americans from artists to architectural engineers in three different categories, is characterized by young intermetropolitan mobility, according to a 2013 paper by Charlynn Burd of the US Census Bureau. The creative class categories include “analytic,” ranging from the biological and computer scientists, “synthetic,” ranging from architects to engineers, and “symbolic,” including artists, musicians, and the like. The creative class is most mobile during the age range from 25 to 39 when nearly double have changed addresses in the last five years than have stayed put. The age range from 40 to 64, however, shows that reverses to nearly double the number of people maintaining an address for at least five years rather than regularly moving. Although home buying might be pushed back a few more years for the creative class than their counterparts, they still reach an age when most settle in one spot.
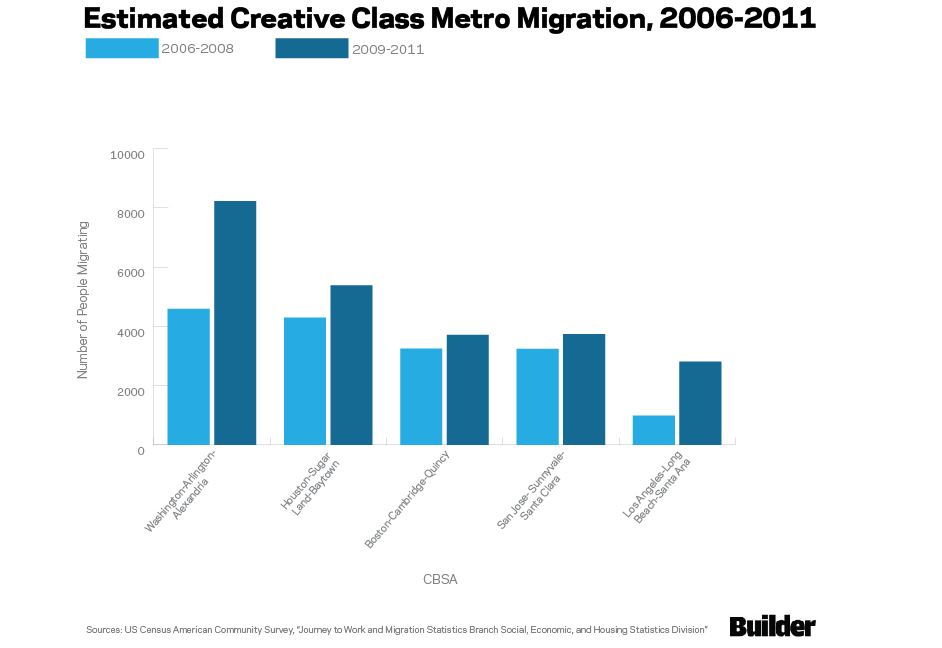
Using data from the American Community Survey marking the three year periods from 2006 through 2008 and 2009 through 2011 and decennial Census data from 2000, Burd highlights the movement of the creative class from city to city. Of selected metros seeing a change in creative class net migration, five showed estimated migration of more than 2,500 people during the 2009 through 2011 period and an increase in migration numbers since the previous American Community Survey 2006 through 2008 period. But did these metro magnets for creativity bring new home buyers to each market’s leading builders?
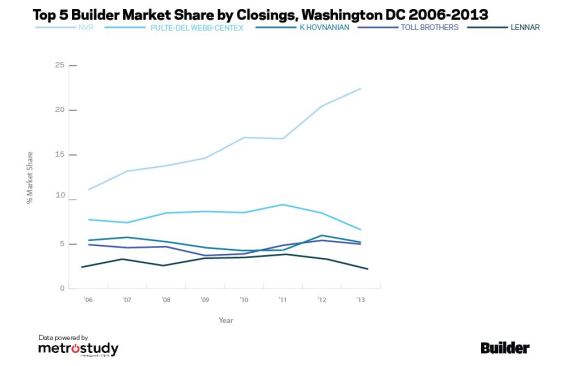
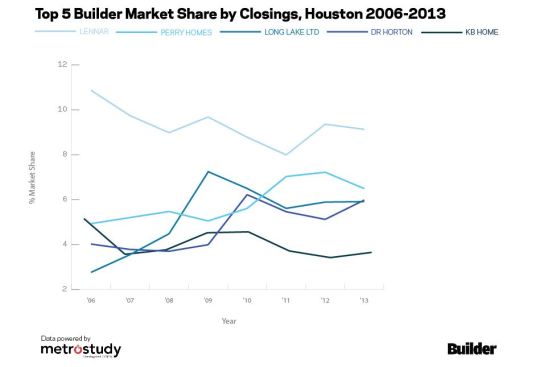
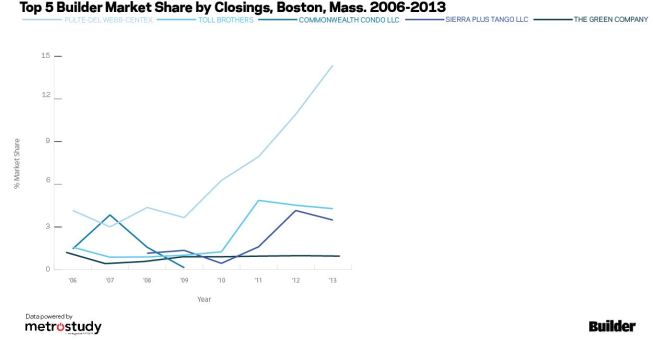
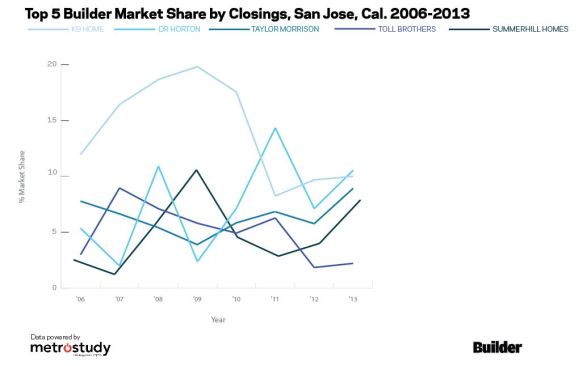
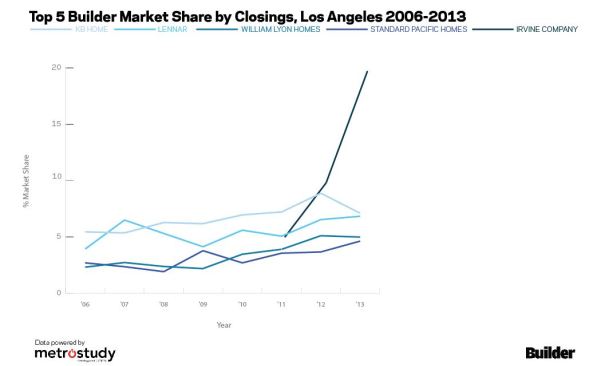
Here, BIG BUILDER explores the creative class magnets. The five cities, which include Washington, DC at the top of the list with nearly double the creative class migration in 2009 through 2011 than the three years prior, each have their top five builders by closings for the period from 2006 extending beyond the American Community Survey through 2013 and their change in market share by closings overtime. Overall, many of the leading builders in these five metros were able to maintain market share by closings without dramatic fluctuation throughout the recession. With the exception of the San Jose CBSA, leaders builders in these metros have experienced slow, but steady incline in market share. Could a strong creative class be one of the keys to a robust new home market?
Further, do home builders’ skills at courting creative class buyers in one market translate into a competitive edge as the new geography of jobs plays out in other markets?
Take a look below.
1. Washington-Arlington-Alexandria, DC-VA-MD-WV
Top 5 Builders & Closings 2006-2013
NVR | 17,887 |
PULTE-DEL WEBB-CENTEX | 9,465 |
K HOVNANIAN | 6,143 |
TOLL BROTHERS | 5,509 |
LENNAR | 4,040 |
2. Houston-The Woodlands-Sugar Land, TX
Top 5 Builders & Closings 2006-2013
LENNAR | 21,999 |
PERRY HOMES | 12,945 |
LONG LAKE LTD | 10,763 |
DR HORTON | 10,356 |
KB HOME | 9,786 |
3. Boston-Cambridge-Newton, MA-NH
Top 5 Builders & Closings 2006-2013
PULTE-DEL WEBB-CENTEX | 1,580 |
TOLL BROTHERS | 537 |
COMMONWEALTH CONDO LLC | 342 |
SIERRA PLUS TANGO LLC | 315 |
THE GREEN COMPANY | 308 |
4. San Jose-Sunnyvale-Santa Clara, CA
Top 5 Builders & Closings 2006-2013
KB HOME | 2,413 |
DR HORTON | 1,074 |
TAYLOR MORRISON | 1,074 |
TOLL BROTHERS | 874 |
SUMMERHILL HOMES | 791 |
5. Los Angeles-Long Beach-Anaheim, CA
Top 5 Builders & Closings 2006-2013
KB HOME | 4,497 |
LENNAR | 3,813 |
WILLIAM LYON HOMES | 2,198 |
STANDARD PACIFIC HOMES | 2,113 |
IRVINE COMPANY | 2,020 |
Note: For a full breakdown of each occupational code
included in the three sections of the creative class and their mobility between
CBSAs, see the report here.