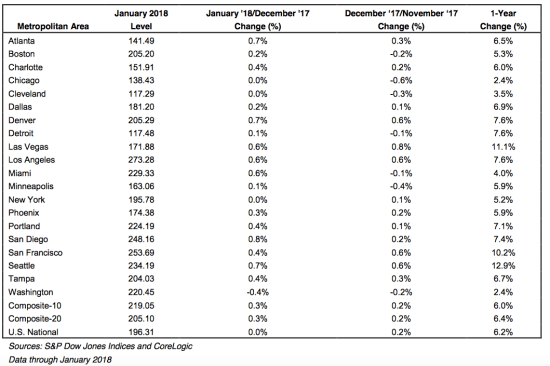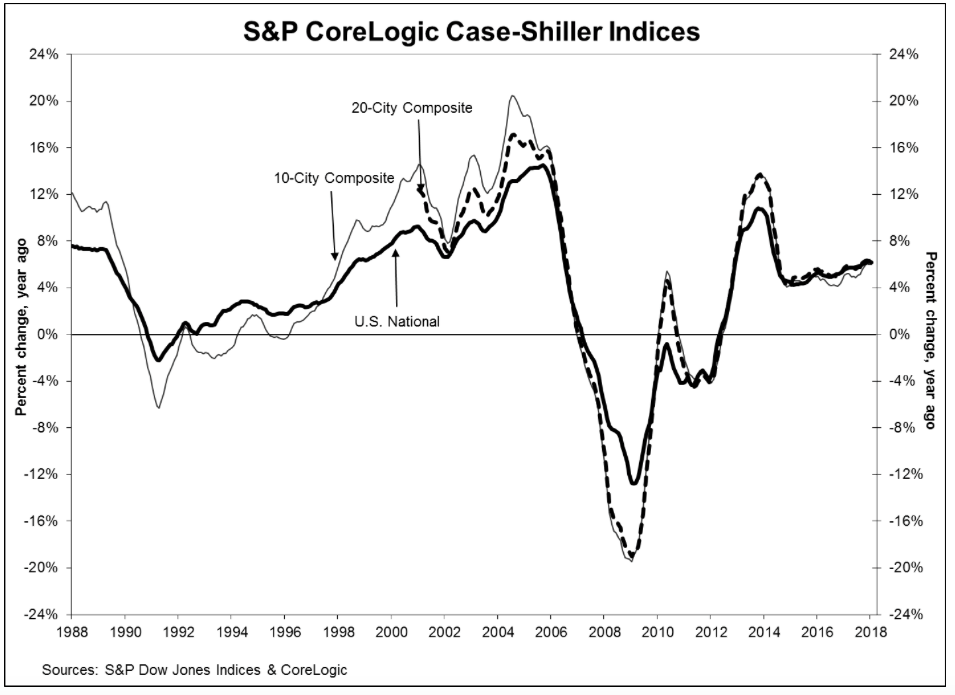
The S&P CoreLogic Case-Shiller U.S. National Home Price NSA Index, covering all nine U.S. census divisions, registered a 6.2% annual gain in January, down from 6.3% in the previous month, S&P Dow Jones reported Tuesday.
The 10-City Composite annual increase came in at 6.0%, no change from the previous month. The 20-City Composite posted a 6.4% year-over-year gain, up from 6.3% in the previous month.
Seattle, Las Vegas, and San Francisco reported the highest year-over-year gains among the 20 cities. In January, Seattle led the way with a 12.9% year-over-year price increase, followed by Las Vegas with an 11.1% increase and San Francisco with a 10.2% increase. Twelve of the 20 cities reported greater price increases in the year ending January 2018 versus the year ending December 2017.
Before seasonal adjustment, the National Index posted a month-over-month gain of 0.05% in January. The 10-City and 20-City Composites both reported increases of 0.3%. After seasonal adjustment, the National Index recorded a 0.5% month-over-month increase in January. The 10-City and 20-City Composites posted 0.7% and 0.8% month-over-month increases, respectively. Sixteen of the 20 cities reported increases in January before seasonal adjustment, while all 20 cities reported increases after seasonal adjustment.
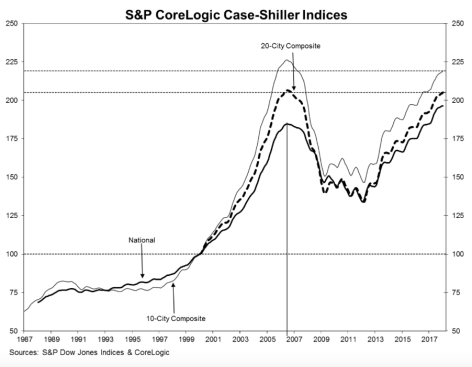
“The home price surge continues,” says David M. Blitzer, managing director and chairman of the Index Committee at S&P Dow Jones Indices. “Since the market bottom in December 2012, the S&P Corelogic Case-Shiller National Home Price index has climbed at a 4.7% real – inflation adjusted – annual rate. That is twice the rate of economic growth as measured by the GDP. While price gains vary from city to city, there are few, if any, really weak spots. Seattle, up 12.9% in the last year, continues to see the largest gains, followed by Las Vegas up 11.1% over the same period. Even Chicago and Washington, the cities with the smallest price gains, saw a 2.4% annual increase in home prices.”
Blitzer continued, “Two factors supporting price increases are the low inventory of homes for sale and the low vacancy rate among owner-occupied housing. The current months-supply — how many months at the current sales rate would be needed to absorb homes currently for sale — is 3.4; the average since 2000 is 6.0 months, and the high in July 2010 was 11.9. Currently, the homeowner vacancy rate is 1.6% compared to an average of 2.1% since 2000; it peaked in 2010 at 2.7%. Despite limited supplies, rising prices, and higher mortgage rates, affordability is not a concern. Affordability measures published by the National Association of Realtors show that a family with a median income could comfortably afford a mortgage for a median priced home.”