Hovnanian Enterprises, Inc. (NYSE: HOV), on Thursday reported net income of $46.2 million, or $0.30 per common share, in the fourth quarter of fiscal 2018 compared with net income of $11.8 million, or $0.08 per common share, during the same quarter a year ago. Analysts were expecting a gain of $0.19 per share.
Shares of HOV, trading as a penny stock, closed up more than 7% on the news.
For the year ended October 31, 2018, net income was $4.5 million, or $0.03 per common share, compared with a net loss of $332.2 million, or $2.25 per common share, including a $294.0 million non-cash increase in the valuation allowance for our deferred tax assets, in fiscal 2017. for its fiscal fourth quarter and year ended October 31, 2018.
Total revenues decreased to $614.8 million in the fourth quarter of fiscal 2018, compared with $721.7 million in the fourth quarter of fiscal 2017. For the year ended October 31, 2018, total revenues decreased to $1.99 billion compared with $2.45 billion in the prior fiscal year.
Home building revenues for unconsolidated joint ventures increased $154.5 million to $252.6 million for the fourth quarter ended October 31, 2018, compared with $98.1 million in last year’s fourth quarter. During all of fiscal 2018, home building revenues for unconsolidated joint ventures increased to $602.7 million compared with $312.2 million in the previous year.
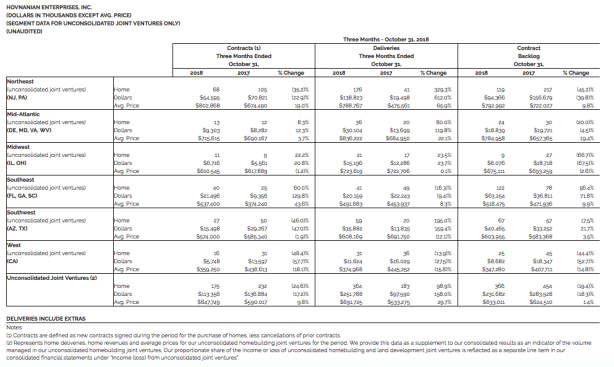
For the quarter ended October 31, 2018, deliveries, including unconsolidated joint ventures, increased 2.4% to 1,829 homes compared with 1,787 homes during the fourth quarter of fiscal 2017. Consolidated deliveries were 1,465 homes for the fourth quarter of fiscal 2018, an 8.7% decrease compared with 1,604 homes during the same quarter a year ago.
For the year ended October 31, 2018, deliveries, including unconsolidated joint ventures, decreased 5.2% to 5,831 homes compared with 6,149 homes in the prior fiscal year. Consolidated deliveries were 4,847 homes in fiscal 2018, a 13.5% decrease compared with 5,602 homes in the same period in fiscal 2017.
The number of contracts, including unconsolidated joint ventures, for the fourth quarter ended October 31, 2018, decreased 12.3% to 1,179 homes from 1,344 homes for the same quarter last year. The number of consolidated contracts decreased 9.7% to 1,004 homes, during the fourth quarter of fiscal 2018, compared with 1,112 homes during the fourth quarter of 2017.
During all of fiscal 2018, the number of contracts, including unconsolidated joint ventures, was 5,586 homes, a decrease of 5.9% from 5,937 homes during fiscal 2017. The number of consolidated contracts decreased 10.1% to 4,671 homes, during the twelve month period ended October 31, 2018, compared with 5,196 homes in the same period of the previous fiscal year.
The dollar value of contract backlog, including unconsolidated joint ventures, as of October 31, 2018, was $977.3 million, a decrease of 10.5% compared with $1.09 billion as of October 31, 2017. The dollar value of consolidated contract backlog, as of October 31, 2018, decreased 7.7% to $745.6 million compared with $808.0 million as of October 31, 2017.
The contract cancellation rate, including unconsolidated joint ventures, was 22% in both the fourth quarter of fiscal 2018 and fiscal 2017. The consolidated contract cancellation rate was 23% for the three months ended October 31, 2018 compared with 22% for the three months ended October 31, 2017.
Home building gross margin percentage, after cost of sales interest expense and land charges, was 16.5% for the fourth quarter of fiscal 2018 compared with 13.7% in the prior year’s fourth quarter. For the year ended October 31, 2018, home building gross margin percentage, after cost of sales interest expense and land charges, improved to 15.2% compared with 13.2% last year.
Home building gross margin percentage, before cost of sales interest expense and land charges, improved 100 basis points to 19.2% for the fourth quarter of fiscal 2018 compared with 18.2% in the same quarter one year ago. During fiscal 2018, home building gross margin percentage, before cost of sales interest expense and land charges, improved 120 basis points to 18.4% compared with 17.2% in the previous fiscal year.
For the fourth quarter of 2018, total SG&A decreased by $22.0 million, or 30.2%, year over year. Total SG&A was $50.8 million, or 8.3% of total revenues, in the fourth quarter of fiscal 2018 compared with $72.9 million, or 10.1% of total revenues, in the fourth quarter of fiscal 2017. For the year ended October 31, 2018, total SG&A decreased by $26.9 million, or 10.5%, year over year. For all of fiscal 2018, total SG&A was $228.8 million, or 11.5% of total revenues, compared with $255.7 million, or 10.4% of total revenues, in the prior fiscal year.
Total interest expense was $38.8 million in the fourth quarter of fiscal 2018 compared with $59.3 million in the fourth quarter of fiscal 2017. Total interest expense was $164.0 million for all of fiscal 2018 compared with $185.8 million for all of fiscal 2017.
Interest incurred (some of which was expensed and some of which was capitalized) was $39.4 million for the fourth quarter of fiscal 2018 compared with $43.3 million in the same quarter one year ago. For the year ended October 31, 2018, interest incurred (some of which was expensed and some of which was capitalized) was $161.0 million compared with $160.2 million last year.
Income before income taxes for the quarter ended October 31, 2018 was $48.1 million compared with $12.3 million during the fourth quarter of fiscal 2017. For all of fiscal 2018, income before income taxes was $8.1 million compared with loss of $45.2 million during all of fiscal 2017.
As of the end of the fourth quarter of fiscal 2018, community count, including unconsolidated joint ventures, was 142 communities, a 9.6% year-over-year decrease from 157 communities at October 31, 2017. Consolidated community count decreased 5.4% to 123 communities as of October 31, 2018 from 130 communities at the end of the prior year’s fourth quarter.
Contracts per community, including unconsolidated joint ventures, decreased 3.5% to 8.3 contracts per community for the quarter ended October 31, 2018 compared with 8.6 contracts per community, including unconsolidated joint ventures, in last year’s fourth quarter. Consolidated contracts per community decreased 4.7% to 8.2 contracts per community for the fourth quarter of fiscal 2018 compared with 8.6 contracts per community in the fourth quarter of fiscal 2017.
Although contracts per community, including unconsolidated joint ventures, were down slightly for the quarter, contracts per community, including unconsolidated joint ventures, increased in September 2018 to 2.7 compared with 2.5 in September 2017 and increased in October 2018 to 2.9 compared with 2.8 in October 2017.
Contracts per community, including unconsolidated joint ventures, increased 6.4% to 36.8 contracts per community for the year ended October 31, 2018 compared with 34.6 contracts per community, including unconsolidated joint ventures, in all of fiscal 2017. Consolidated contracts per community increased 2.6% to 36.0 contracts per community for all of fiscal 2018 compared with 35.1 contracts per community in the year ended October 31, 2017.
As of the end of the fourth quarter of fiscal 2018, community count, including unconsolidated joint ventures, was 142 communities, a 9.6% year-over-year decrease from 157 communities at October 31, 2017. Consolidated community count decreased 5.4% to 123 communities as of October 31, 2018 from 130 communities at the end of the prior year’s fourth quarter.
The valuation allowance was $638.2 million as of October 31, 2018. The valuation allowance is a non-cash reserve against the Company’s tax assets for GAAP purposes. For tax purposes, the tax deductions associated with the tax assets may be carried forward for 20 years from the date the deductions were incurred.
Total liquidity at the end of the of fiscal 2018 was $325.6 million.
In the fourth quarter of fiscal 2018, approximately 2,500 lots were put under option or acquired in 34 communities, including unconsolidated joint ventures.
As of October 31, 2018, consolidated lots controlled increased by 19.8% to 30,339 year over year from 25,329 lots at October 31, 2017. The consolidated land position, as of October 31, 2018, was 30,339 lots, consisting of 17,610 lots under option and 12,729 owned lots.
“We are pleased to report solid performance in our fourth quarter. We exceeded or met our guidance for total revenues, gross margin, SG&A expense ratio and adjusted pretax profits,” stated Ara K. Hovnanian, chairman, president and CEO. “Given the recent consumer hesitation in purchasing homes, we remain cautious and are carefully evaluating current market conditions when underwriting new land acquisitions. Nonetheless, we continue to move forward with our goal of increasing our community count. Our total consolidated lots controlled at the end of the fourth quarter expanded 20% year over year.”
“We recognize that there has been an overall industry cooling in home sales during the quarter; a time when mortgage rates rose and stock market volatility caused hesitation among potential home buyers. However, given the overall demographic trends and the strong U.S. economy, as home buyers become adjusted to the higher mortgage rate environment, expectations will likely adjust and the housing market should resume its path of recovery,” Hovnanian said.