Interest rates. They exert pressure on home builders, not just now, but tomorrow, and the day after, too. They forcefully impact our ability to acquire and develop assets, and, in turn, they directly impact our ability to get a return on them. It’s difficult enough to course-correct tactically for higher short-term rates’ impact on today’s balance sheets, as we adjust for the higher cost of borrowing money.
Wouldn’t it be great, though, to be able to look at interest rate trends today for signs of where they’ll be in the weeks, months, and even years ahead? There are ways to do just that. Not that anyone can totally remove uncertainty from the equation, but one of the most dependable ways to decipher what’s around the corner for interest rates is to look at the trending relationship between short-term and long-term rates today.
Federal Reserve Board adjustments have been dominating interest rate news and headlines for two years. Recent economic data, however, showed a flattening and—at the end of 2005—inverted yield curve. This is a big “uh oh” moment, because inverted yield curves have foreshadowed each of the last five recessions. Why now? Our economy is finally moving forward, showing strong GDP and employment growth. What possible trouble can the yield curve data be signaling? Does the inversion mean tougher times for home builders? Or, on the contrary, can this economic turn of events somehow be regarded as good news?
First, we need to know how the yield curve works. What is it, and how does it connect with home building trends? Interestingly, yield curve data can and do tell us a lot about what the markets expect interest rates to do.
THE TECHNICAL SKINNY The yield curve charts the yields-to-maturity (interest rates) of a range of short-term, medium-term, and long-term debt securities—known as “Treasury notes”—issued by the United States government. These notes serve as the model for the yield curve because they are deemed to be risk free. The interest rates of U.S. Treasury notes are void of default risk. Non-U.S. government debt securities are not immune to risk. Interest rates on non-U.S. government securities go up or down based on the perceived risk of default. Riskier credits get higher interest rate than less risky credits. Simplistically, the yield-to-maturity of a Treasury is the effective interest rate received by the holder of the security.
The yield-to-maturity figure on short-term securities tends to run lower than on longer-term securities. Investors in longer-term securities almost invariably demand higher interest rates because the longer time they have to hold the security before it reaches maturity, the greater the assumed risk. In turn, the shorter the time period leading to maturity, the less risky the deal. Here’s a little more explanation.
Inflation impacts the values of debt securities. Higher inflation reduces the value of Treasury notes. This accounts for the phrase, “Yields move inversely to prices”—when we’re dealing with bonds. Since the coupon rate of the Treasury is fixed at the time of issue, if the required interest rate demanded by investors increases, the price of the bond must fall to compensate the investor. It’s a little tricky, but if you think about it, it makes sense.
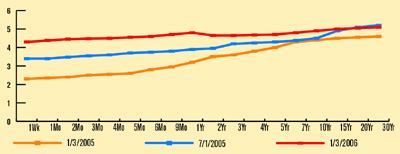
In early 2005, the difference between the two- and 10-year Treasury yields was nearly 120 basis points, or 1.20 percentage points. (Each basis point equals one one-hundredth of a percentage point.)
Looking back, in May of 2004, the spread between the two-year and 10-year Treasury notes was 219 basis points. It was no coincidence that the Fed started raising the Federal Funds Rate one month later, a rate that has gone up a total of 325 basis points through the beginning of 2006.
An inverted yield curve happens when investors in short-term Treasurys require higher yields than investors in long-term Treasurys. The phenomenon causes the yield curve to slope downward. An inverted curve implies investors believe interest rates will go down.