
The U.S. population is decelerating after decades of steady growth, and future immigration levels remain difficult to forecast amid evolving federal policy. Against that backdrop, domestic migration has taken on outsized importance for builders and developers trying to understand where housing demand will concentrate next. When fewer net new residents are being added nationally, the movement of existing households between markets becomes a primary driver of local housing.
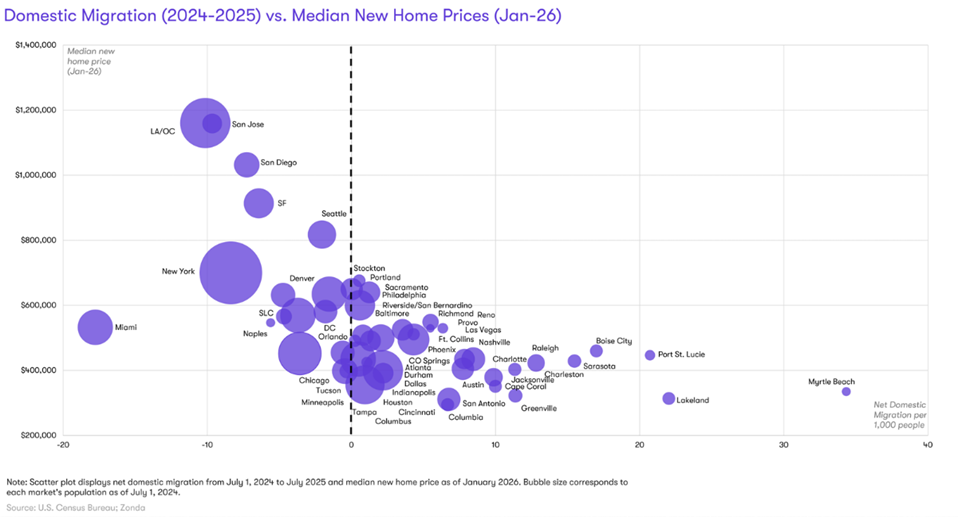
Zonda’s chart below compares market-level net domestic migration from 2024 to 2025 with median new-home prices. Together, these metrics illustrate not just where people are moving, but where builders are more likely to find sustained demand at achievable price points.
High Prices, Persistent Outflows
Markets to the left of the dashed line experienced negative domestic migration, and unsurprisingly, many also rank among the nation’s most expensive housing markets. Los Angeles/Orange County, San Jose, San Diego, San Francisco, and New York all post median new-home prices ranging from roughly $700,000 to well over $1 million, and each continued to lose domestic residents.
These metros remain economically vital, but affordability constraints are increasingly narrowing the pool of potential buyers. As a result, new-home demand in these markets is increasingly concentrated among higher‑income buyers rather than broad‑based household formation.
Stable Markets in the Middle
Near the center of the chart sit many Midwest and interior metros, including Chicago, Minneapolis, Columbus, and Denver. These markets tend to show modest migration gains or near neutral flows, with median new-home prices generally between $350,000 and $500,000.
These areas benefit from relative affordability and diversified employment bases, but they lack the strong inbound momentum seen elsewhere. As a result, housing demand is often steady rather than explosive. For builders, success in these markets typically hinges on disciplined land acquisition and realistic absorption assumptions.
Where Migration and Affordability Align
The right side of the chart highlights the markets drawing the most domestic migrants, often while maintaining comparatively attainable pricing. Lakeland, Port St. Lucie, Myrtle Beach, Boise, and several Southeast metros stand out for combining strong net in migration with median new-home prices below or near $400,000.
These markets continue to benefit from lifestyle appeal, tax advantages, and the ability for households to trade higher cost metros for more affordable housing. However, even within these growth markets, price sensitivity is rising. Builders are increasingly challenged to deliver homes that align with local incomes while managing higher land, labor, and development costs.
Implications for Builders
With population growth slowing and immigration policy in flux, domestic migration will remain a key lens for evaluating housing demand. Markets gaining residents offer runway, but only when pricing aligns with buyer capacity. Meanwhile, high-cost metros require a sharper focus on scarcity driven demand and premium positioning.
Understanding where people are moving, and what they can afford when they arrive, is becoming just as important as understanding rates or construction costs.
The insights in this article were taken from more in-depth webinars available for subscribers to Zonda’s National Outlook.