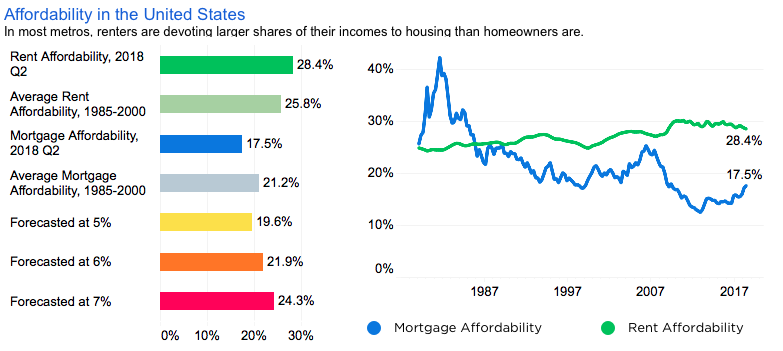
A monthly mortgage payment for the typical U.S. home requires 17.5% of the median income, up from 15.4% a year earlier, according to Zillow®’s second quarter affordability report out Thursday.
The monthly mortgage burden is greater than the historic average in 10 of the 50 biggest U.S. housing markets, the report said. Seven of these 10 markets are along the West Coast, which has seen particularly strong home value appreciation since the recession.
The typical rent now requires 28.4% of the median income, slightly lower than it did a year ago as rent growth has slowed below the pace of income growth. Although rent affordability remains worse today than it was in the 1980s and 1990s, it has gradually improved after peaking in late 2010.
“Low mortgage rates have kept first-time homeownership and move-up homes within reach for many Americans, even as home values have soared to new heights,” said Zillow Senior Economist Aaron Terrazas. “While mortgage rates remain low by historic standards, they are creeping upward, eating into what buyers can pay, and in a handful of pricey markets, affordability already looks unnervingly low. Among lower-income buyers in those pricey markets, it is outright impossible to afford the mortgage on even a lower-priced home. As rates rise, both buyers and sellers will have to temper their expectations further.”
The diminished housing affordability is especially notable for lower-income renters. Nationwide, the typical rent in the most affordable third of the market requires 62.7% of the median income in the lowest third of incomes. In all of the 35 largest housing markets, the typical rent for a more affordable rental requires at least 40% of the median bottom-third income.
Similarly, mortgage payments for the lowest-income earners are also significantly more burdensome than for those earning the most, even if they buy a home in the most affordable third of the market. Mortgage payments require nearly twice as much of the median income for lower-earning buyers (23.9%) than they do for the highest-income buyers (12.9%).
The difference in the financial burden between higher-income and lower-income renters and buyers is greatest in Los Angeles. The median rent in the least expensive third of the market required more than 100% of the typical income for the lowest-earning people living there. That leaves few options to realistically afford rent and other expenses on a typical income, outside of a housing subsidy, doubling up with roommates or taking on a second or even a third job to help make ends meet.
Metropolitan Area | Share of Income Spent On Mortgage (Q2 2018) | Historic Share of Income Spent On Mortgage (1985-2000) | Share of Income Spent On Mortgage for Lower-Income Buyers (Q2 2017) | Share of Income Spent On Rent (Q2 2018) | Historic Share of Income Spent On Rent (1985-2000) | Share of Income Spent On Rent for Lower-Income Renters (Q2 2017) |
United States | 17.5% | 21.2% | 23.9% | 28.4% | 25.8% | 62.7% |
New York, NY | 27.9% | 29.2% | 49.1% | 37.7% | 26.3% | 102.9% |
Los Angeles-Long Beach-Anaheim, CA | 45.0% | 34.6% | 83.8% | 46.9% | 36.3% | 121.2% |
Chicago, IL | 15.6% | 23.1% | 22.8% | 28.3% | 25.3% | 69.3% |
Dallas-Fort Worth, TX | 16.7% | 22.9% | 21.6% | 28.4% | 21.8% | 57.8% |
Philadelphia, PA | 16.1% | 20.4% | 20.4% | 27.1% | 21.4% | 65.0% |
Houston, TX | 15.1% | 21.1% | 23.4% | 28.8% | 24.4% | 66.1% |
Washington, DC | 19.4% | 22.3% | 29.6% | 25.4% | 17.7% | 55.4% |
Miami-Fort Lauderdale, FL | 24.9% | 20.3% | 30.5% | 41.5% | 28.6% | 90.7% |
Atlanta, GA | 15.2% | 18.3% | 18.9% | 25.4% | 19.3% | 49.2% |
Boston, MA | 25.8% | 26.3% | 46.4% | 32.7% | 26.4% | 83.0% |
San Francisco, CA | 44.9% | 38.5% | 73.0% | 39.2% | 30.6% | 95.9% |
Detroit, MI | 12.9% | 16.0% | 7.6% | 24.4% | 20.0% | 46.0% |
Riverside, CA | 28.3% | 27.9% | 45.3% | 36.8% | 32.7% | 74.4% |
Phoenix, AZ | 20.2% | 21.1% | 31.4% | 26.4% | 22.8% | 58.6% |
Seattle, WA | 28.6% | 25.9% | 42.3% | 30.9% | 23.8% | 64.0% |
Minneapolis-St Paul, MN | 16.7% | 17.8% | 27.0% | 25.5% | 21.2% | 56.0% |
San Diego, CA | 37.9% | 33.5% | 67.8% | 40.3% | 34.7% | 94.9% |
St. Louis, MO | 12.6% | 17.0% | 13.0% | 21.8% | 21.2% | 41.5% |
Tampa, FL | 18.7% | 18.8% | 22.4% | 31.0% | 27.6% | 66.2% |
Baltimore, MD | 16.0% | 21.6% | 18.9% | 25.6% | 27.0% | 60.2% |
Denver, CO | 25.3% | 22.5% | 39.8% | 32.0% | 23.6% | 66.1% |
Pittsburgh, PA | 11.7% | 13.8% | 11.7% | 21.9% | 28.5% | 45.8% |
Portland, OR | 26.1% | 22.0% | 45.5% | 29.9% | 23.5% | 68.8% |
Charlotte, NC | 15.1% | 18.7% | 19.3% | 24.4% | 19.3% | 50.5% |
Sacramento, CA | 28.8% | 29.2% | 52.5% | 32.4% | 31.8% | 76.1% |
San Antonio, TX | 15.4% | 22.1% | 20.3% | 27.1% | 26.2% | 57.9% |
Orlando, FL | 20.2% | 20.6% | 26.7% | 31.5% | 22.7% | 63.7% |
Cincinnati, OH | 12.5% | 18.3% | 17.7% | 24.2% | 19.1% | 51.9% |
Cleveland, OH | 12.7% | 19.8% | 15.2% | 25.1% | 22.9% | 55.2% |
Kansas City, MO | 13.8% | 17.2% | 14.5% | 23.5% | 17.5% | 41.2% |
Las Vegas, NV | 22.5% | 26.7% | 30.6% | 27.1% | 24.0% | 57.7% |
Columbus, OH | 14.1% | 18.8% | 17.5% | 25.3% | 21.9% | 46.8% |
Indianapolis, IN | 12.5% | 21.9% | 14.1% | 24.0% | 21.9% | 43.3% |
San Jose, CA | 53.5% | 36.1% | 83.9% | 35.6% | 26.1% | 99.8% |
Austin, TX | 19.3% | 28.8% | 30.7% | 26.7% | 23.3% | 61.5% |


